Viewing Electrostatic Potential Maps#
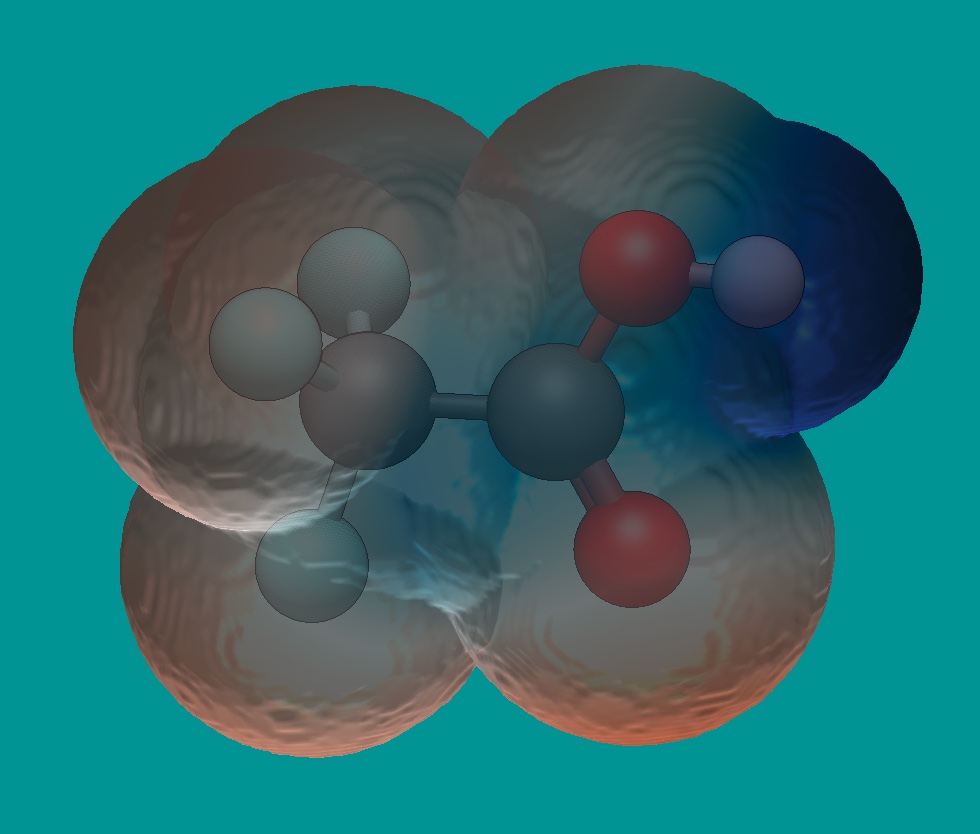
The electrostatic potential maps help to visualize charge distribution, and other charge related properties of molecules.
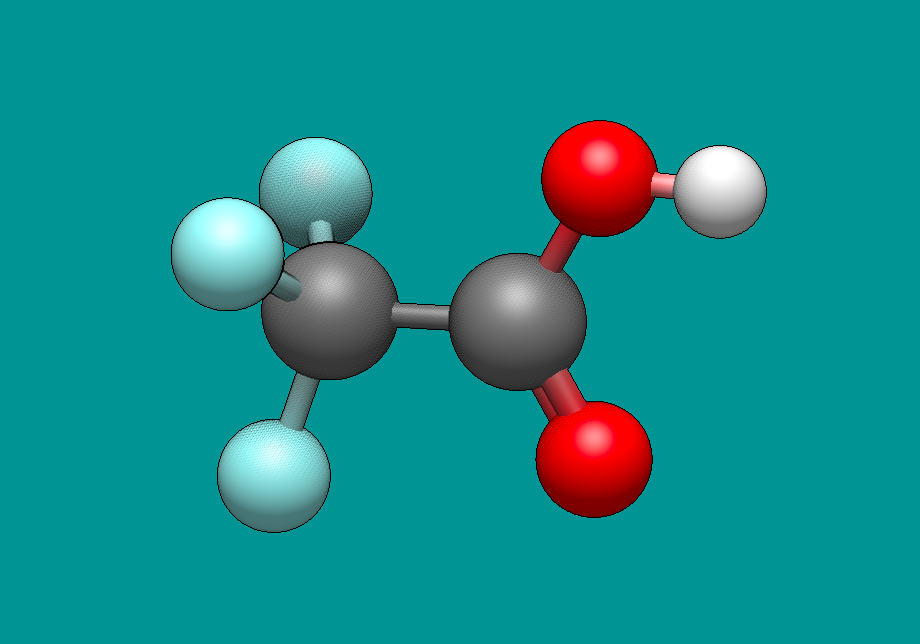
Overall, let’s say you want to determine visually if a specific proton has more or less electron density. First, you’ll want to begin with your molecule of choice (shown below is trifluoracetic acid).
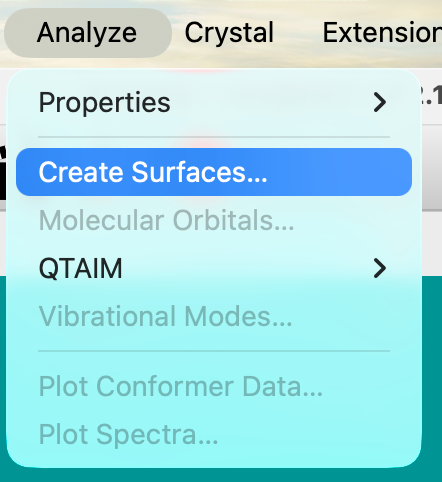
Then under the “Analyze” menu, select “Create Surfaces…”.
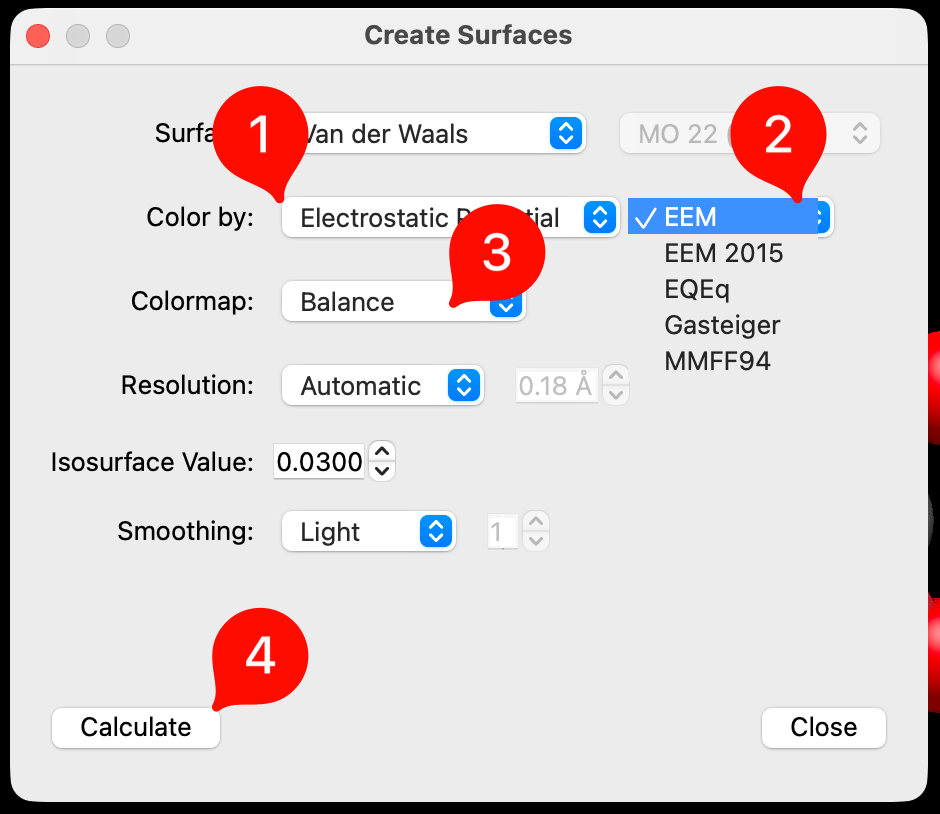
A dialog box will pop up providing you with various surface options. The Van der Waals surface represents the molecular surface defined by the atomic radii, while Solvent Accessible and Solvent Excluded surfaces represent volumes accessible or excluded from the solvent radius of water.

Under “Color By:” select Electrostatic Potential, select an electrostatic model, such as EEM and a color map. and then click “Calculate”. After Avogadro calculates the surface select “Close”.
An electrostatic surface has now been created. From this surface, you can interpret where the most electron density resides (in the more red areas), and where the least electron density resides (deep blue areas). You can further determine, and compare the acidity of various protons, and how surrounding atoms impact the overall electron density.