Analyze Menu#
The Analyze menu contains a wide array of analysis tools for analyzing molecular properties, orbital surfaces, vibrational modes, conformer data, and plotting spectra, as well as tools for performing QTAIM analysis.
- Properties
See Properties.
- Create Surfaces
See Surfaces Dialog.
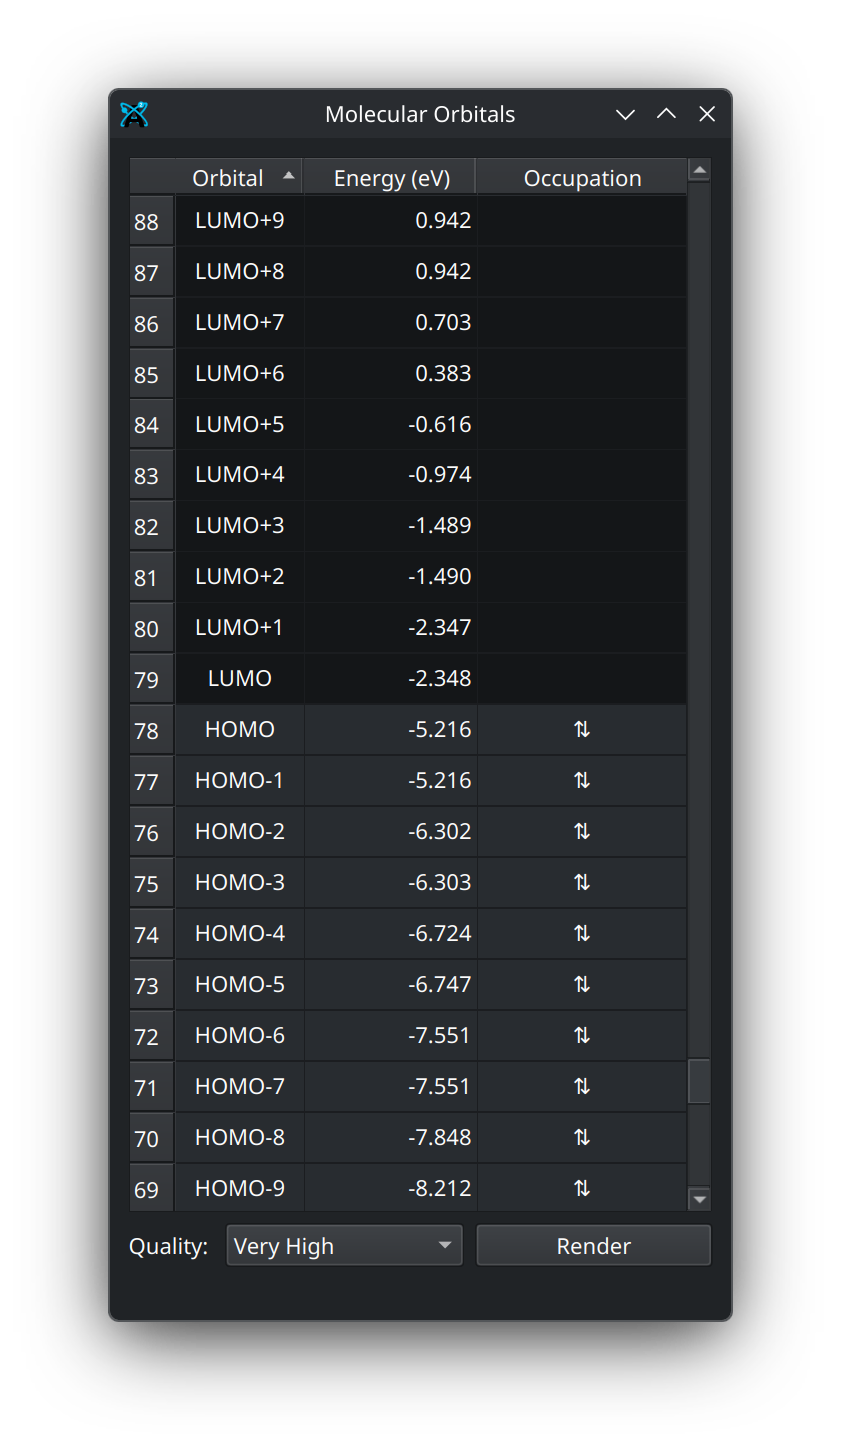
- Molecule Orbitals
Open the molecular orbital window (requires orbitals from a quantum chemistry program).
Molecular Orbital Window
- QTAIM
Run Quantum Theory of Atoms In Molecules (QTAIM) analyses (requires a
.wfnfile).- Vibrational Modes
Open a window with vibrational modes from a quantum chemistry program.
- Plot Conformer Data
Create plots of the conformers in the current document.
- Plot Spectra
Plot electronic and vibrational spectra (IR, NMR, etc.)
Properties#
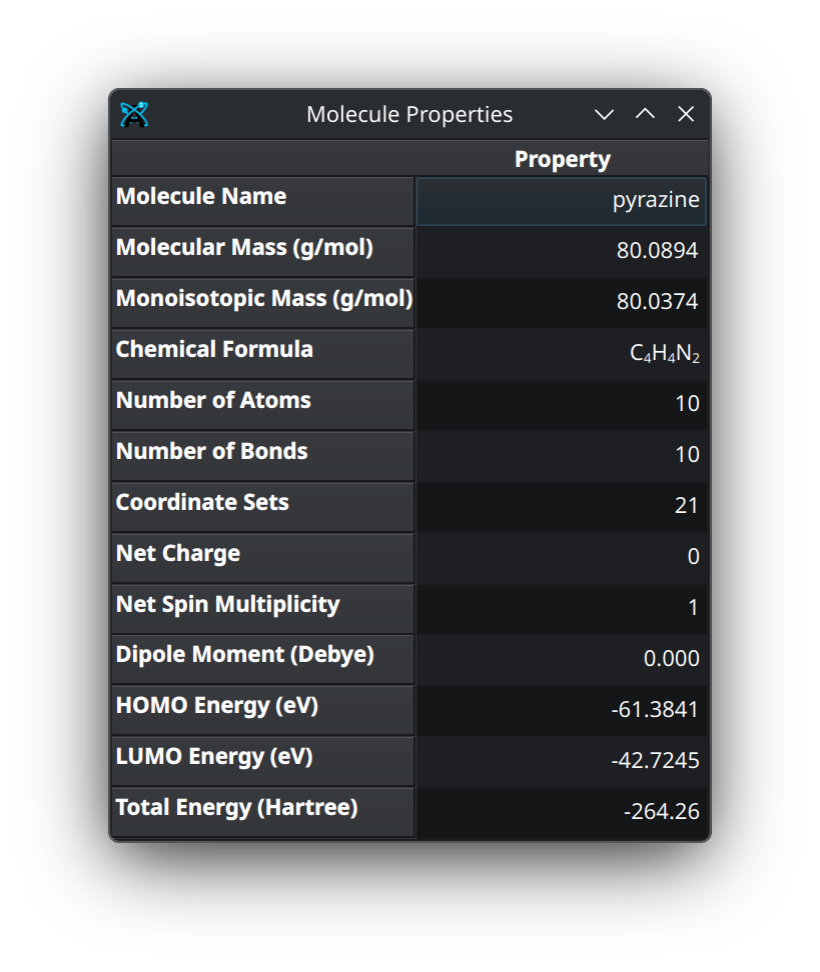
- Molecular
Open a dialog containing basic molecular properties as well as any additional information from a quantum chemical output.
Molecular Properties Dialog
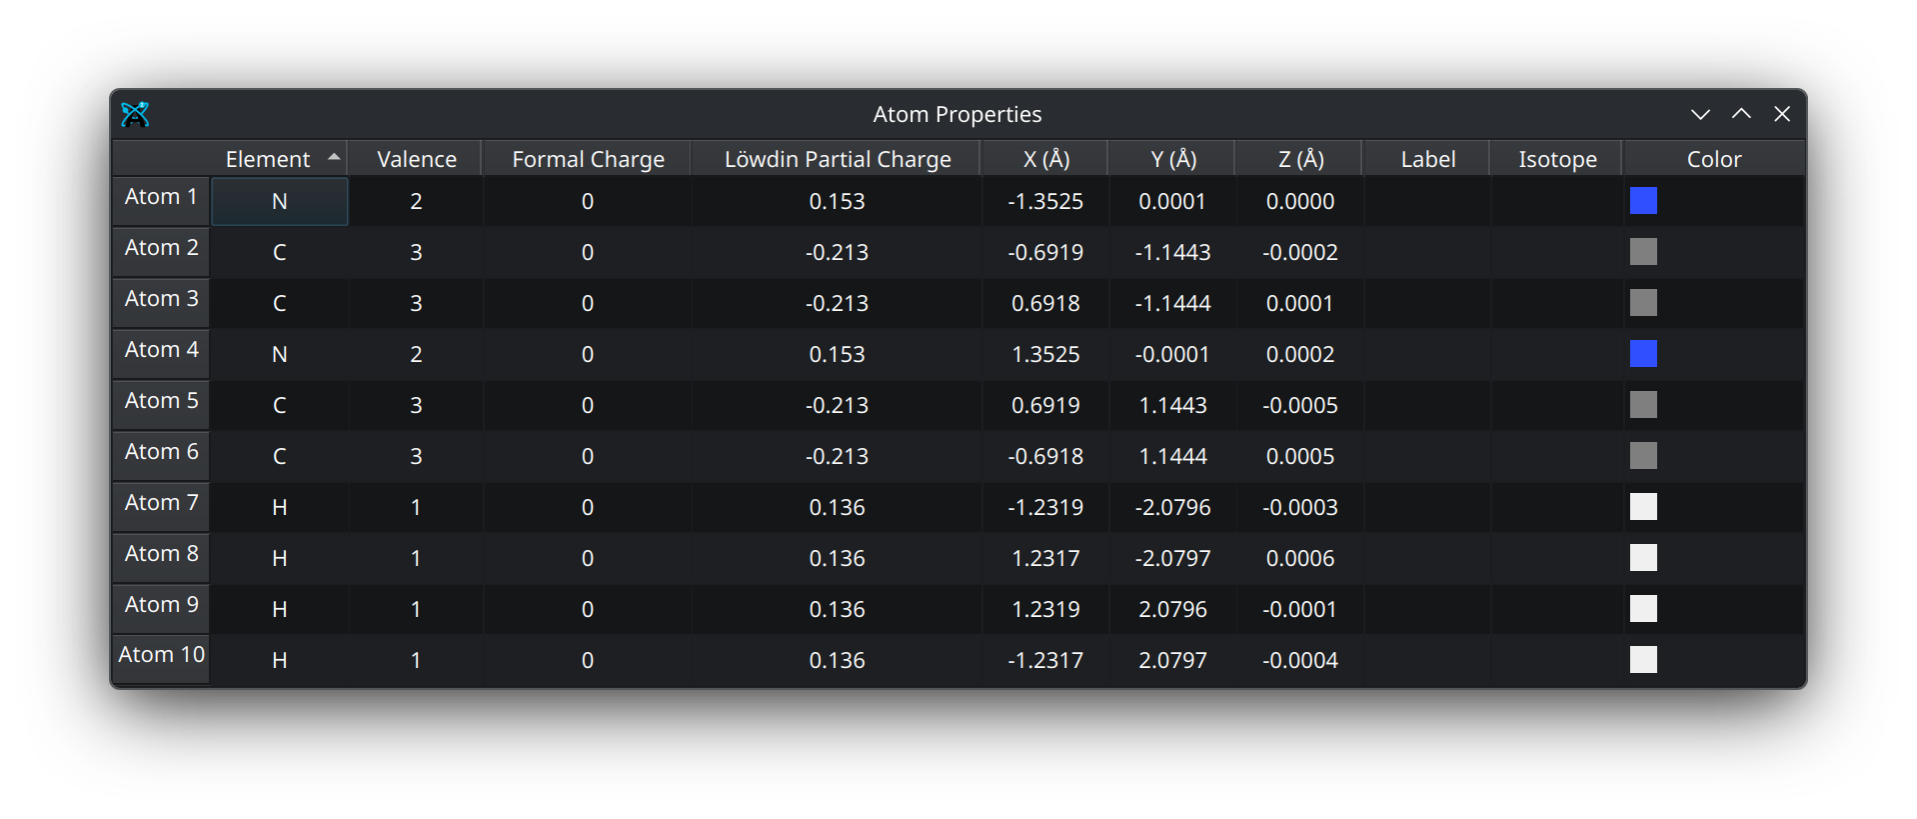
- Atom Properties
Open a dialog containing atomic coordinate information as well as any additional information from a quantum chemical output.
Atom Properties Dialog
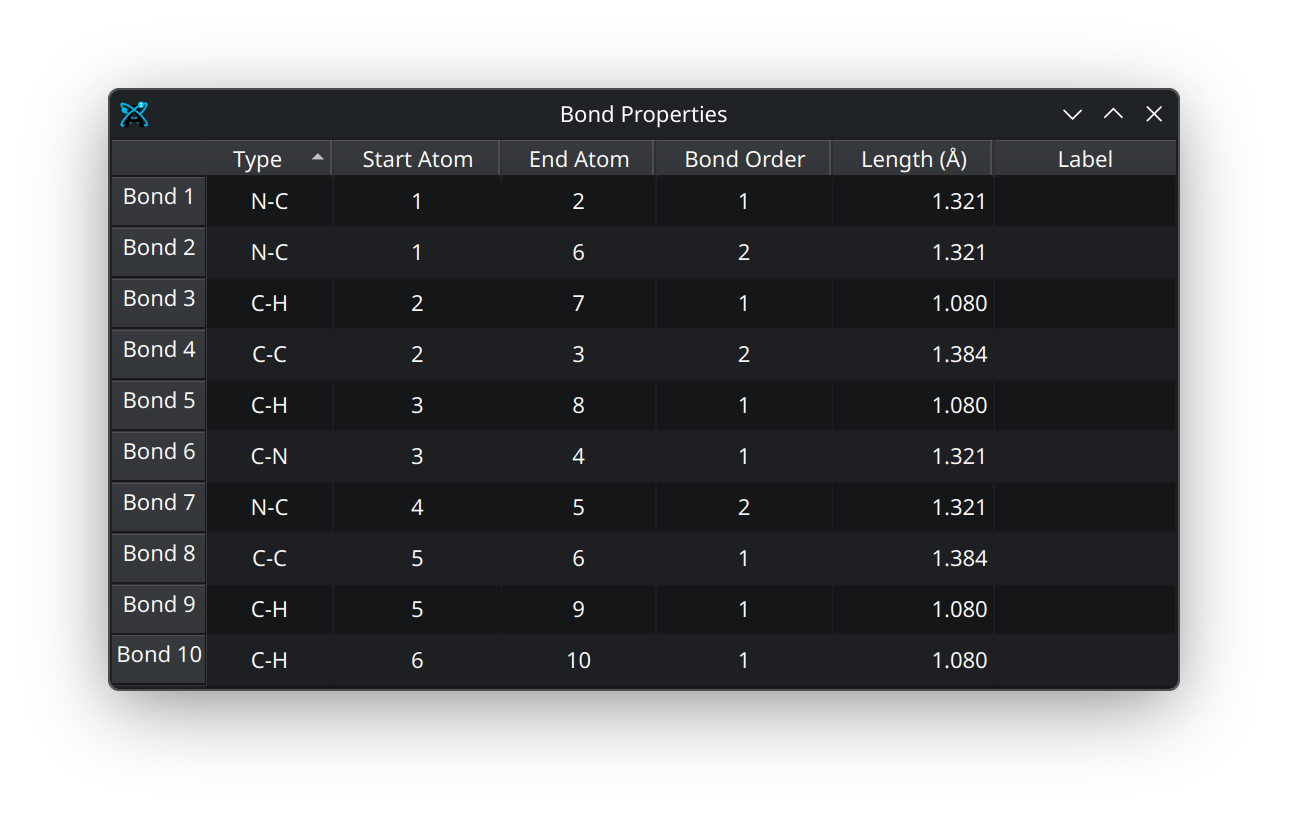
- Bond Properties
Open a dialog containing bonding information.
Bond Properties Dialog
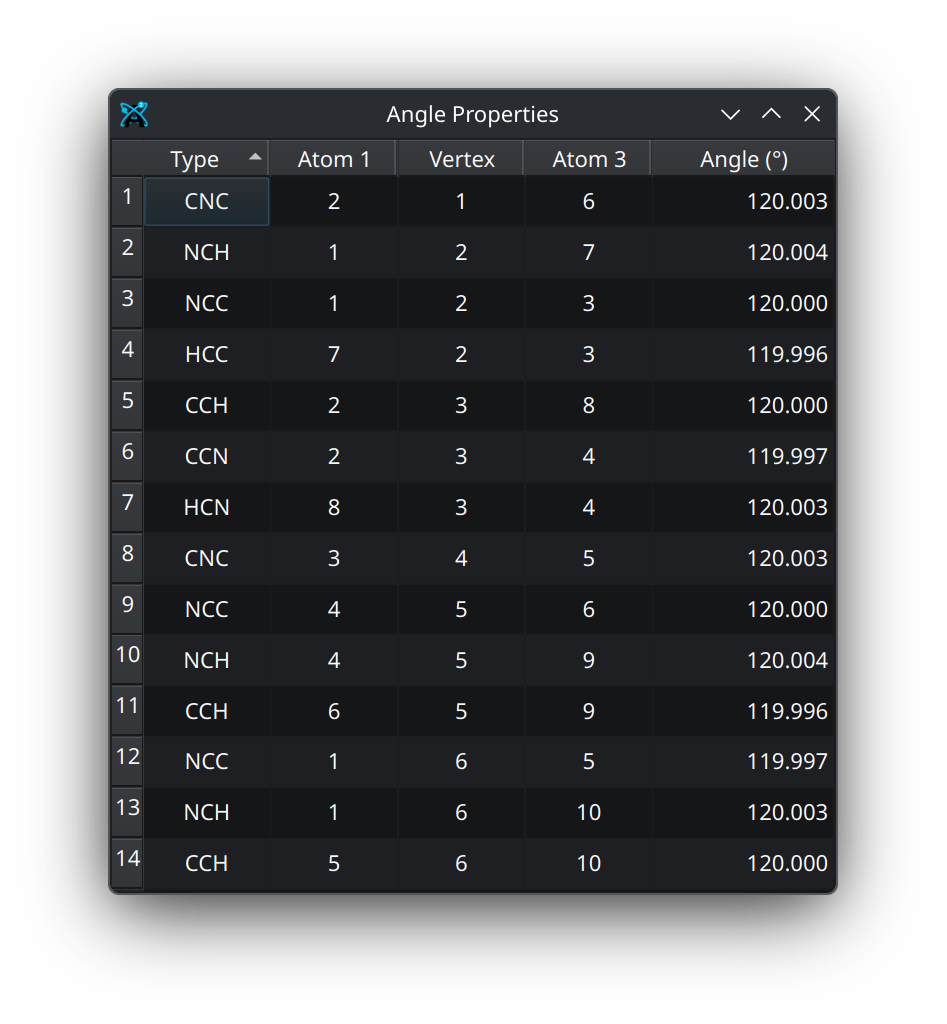
- Angle Properties
Open a dialog containing information about the angles formed by atoms.
Angle Properties Dialog
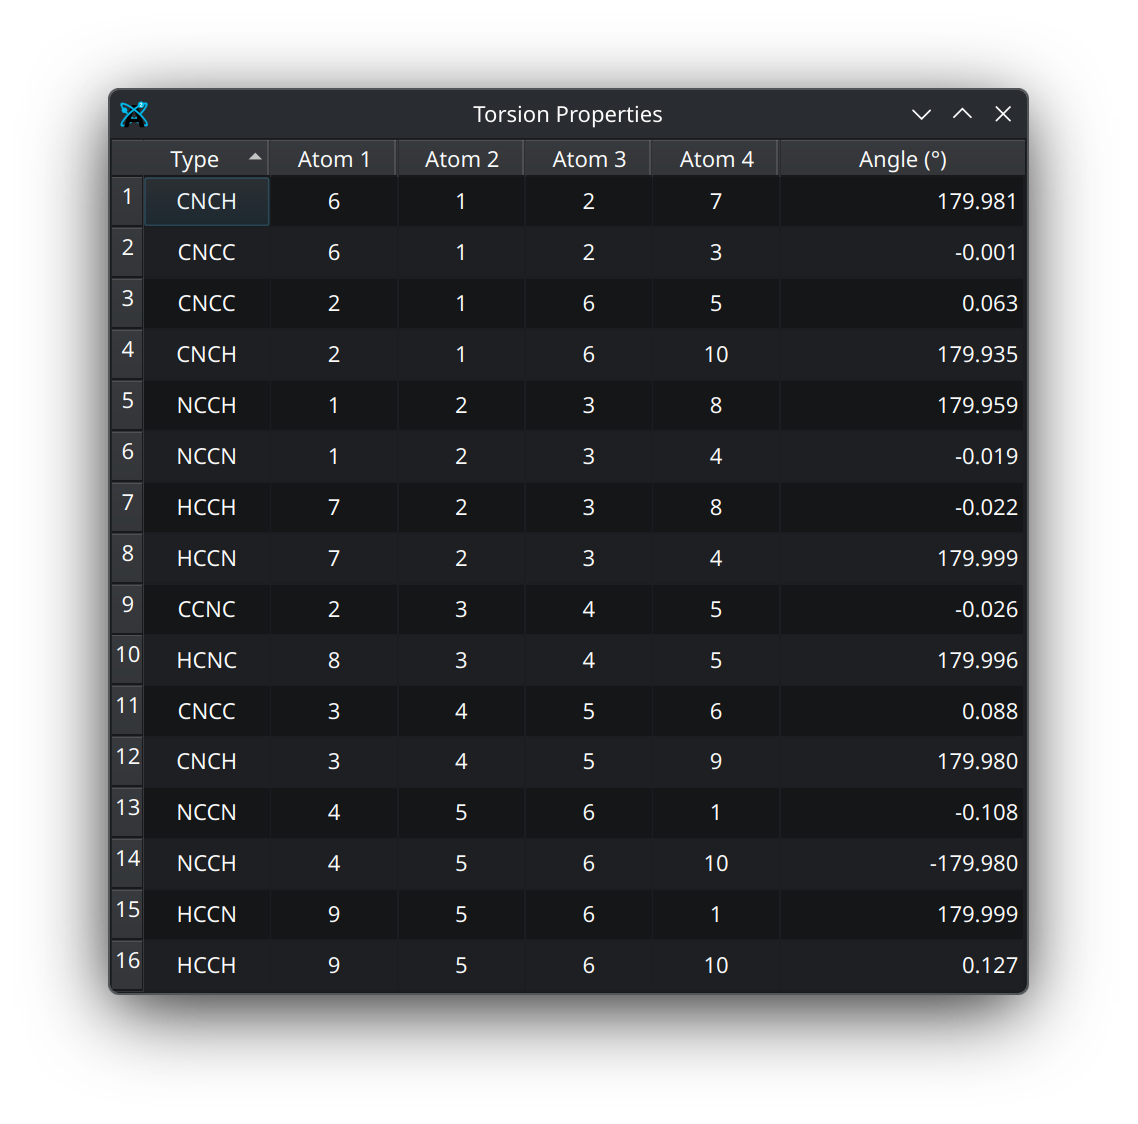
- Torsion Properties
Open a dialog containing information about the dihedrals formed by atoms.
Torsion Properties
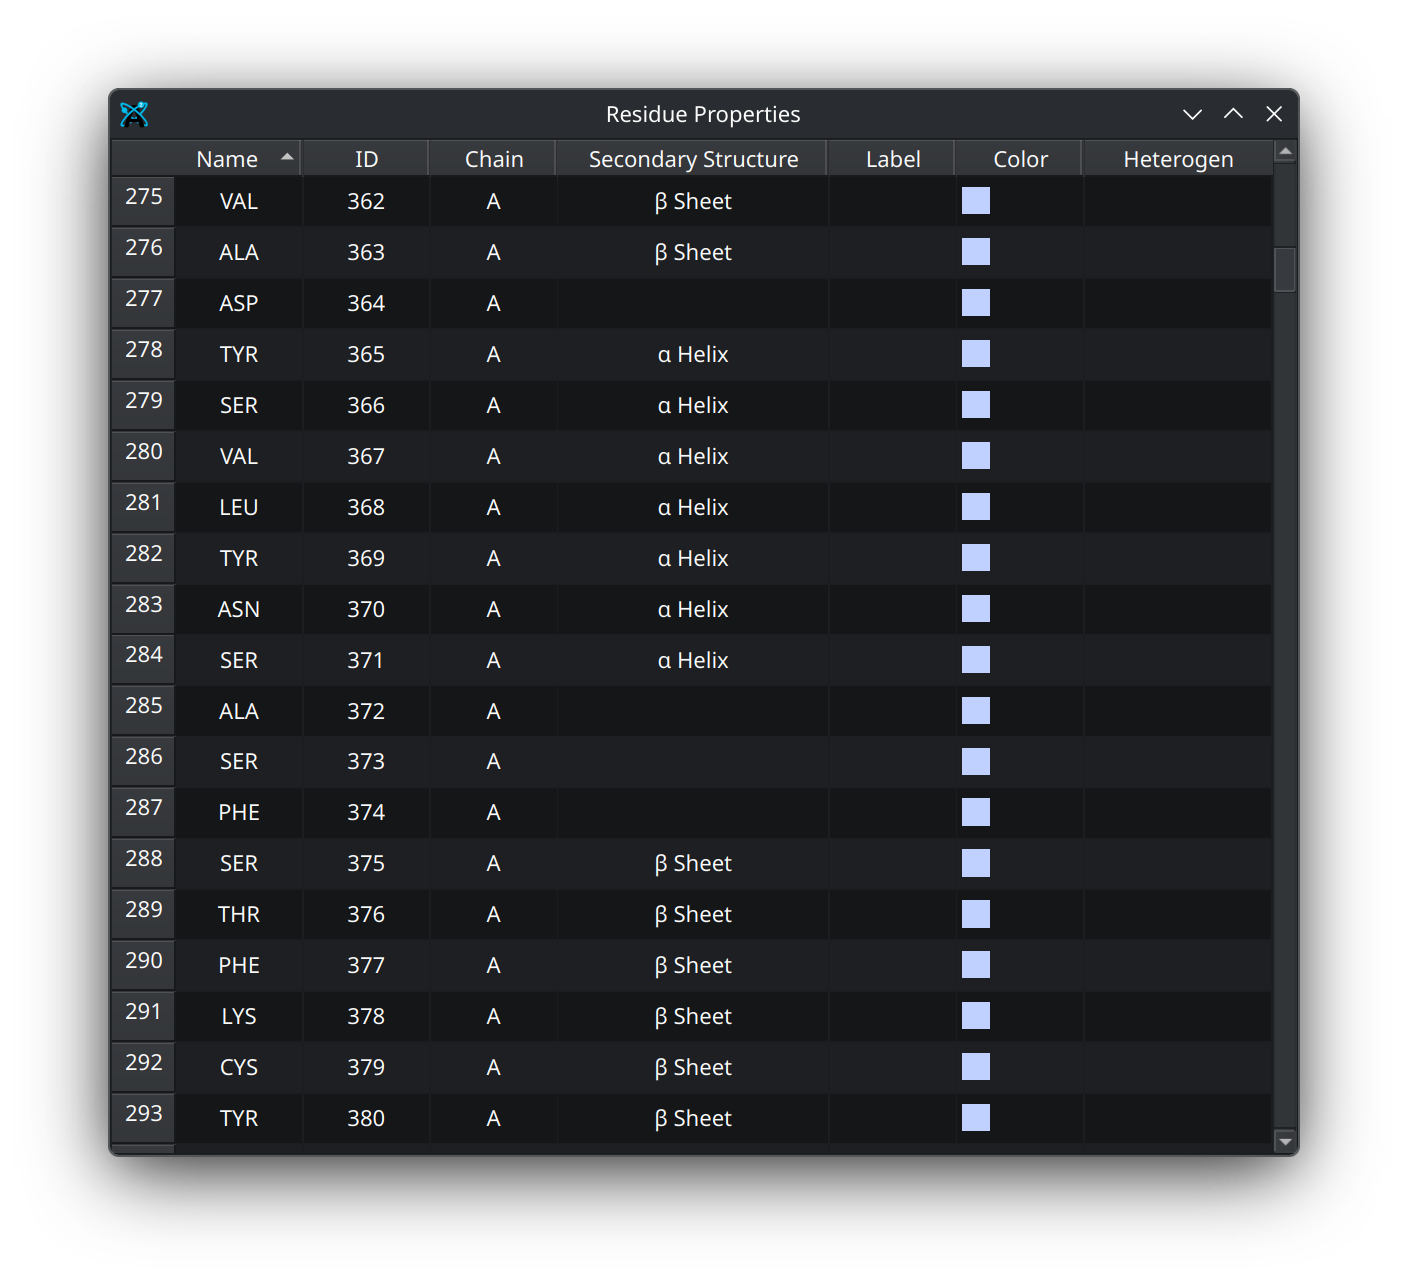
- Residue Properties
Open a dialog containing information about any amino acid residues.
Residue Properties
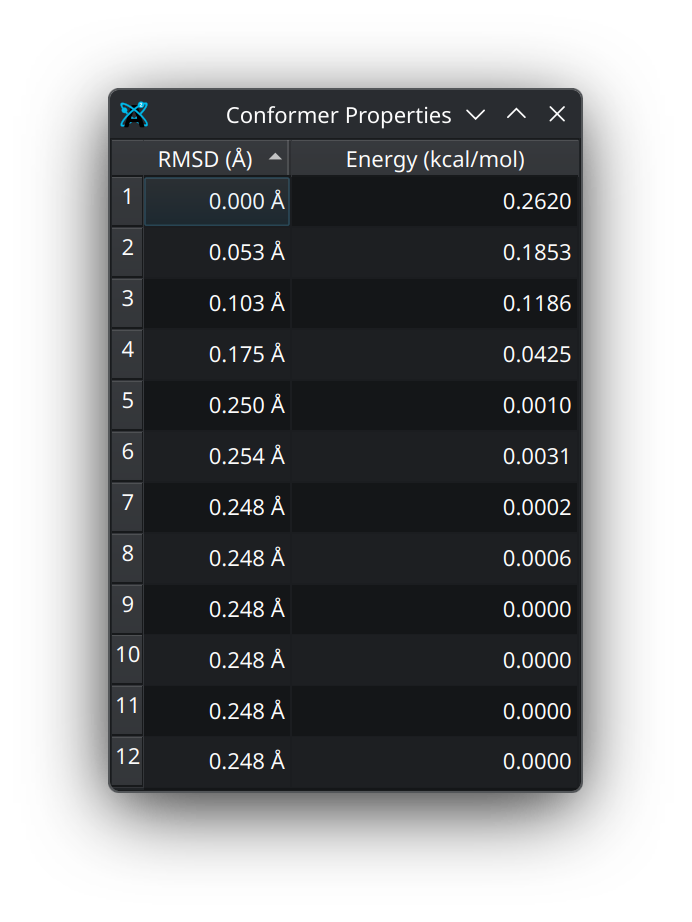
- Conformer Properties
Open a dialog containing information about any conformers present in the document.
Conformer Properties Dialog
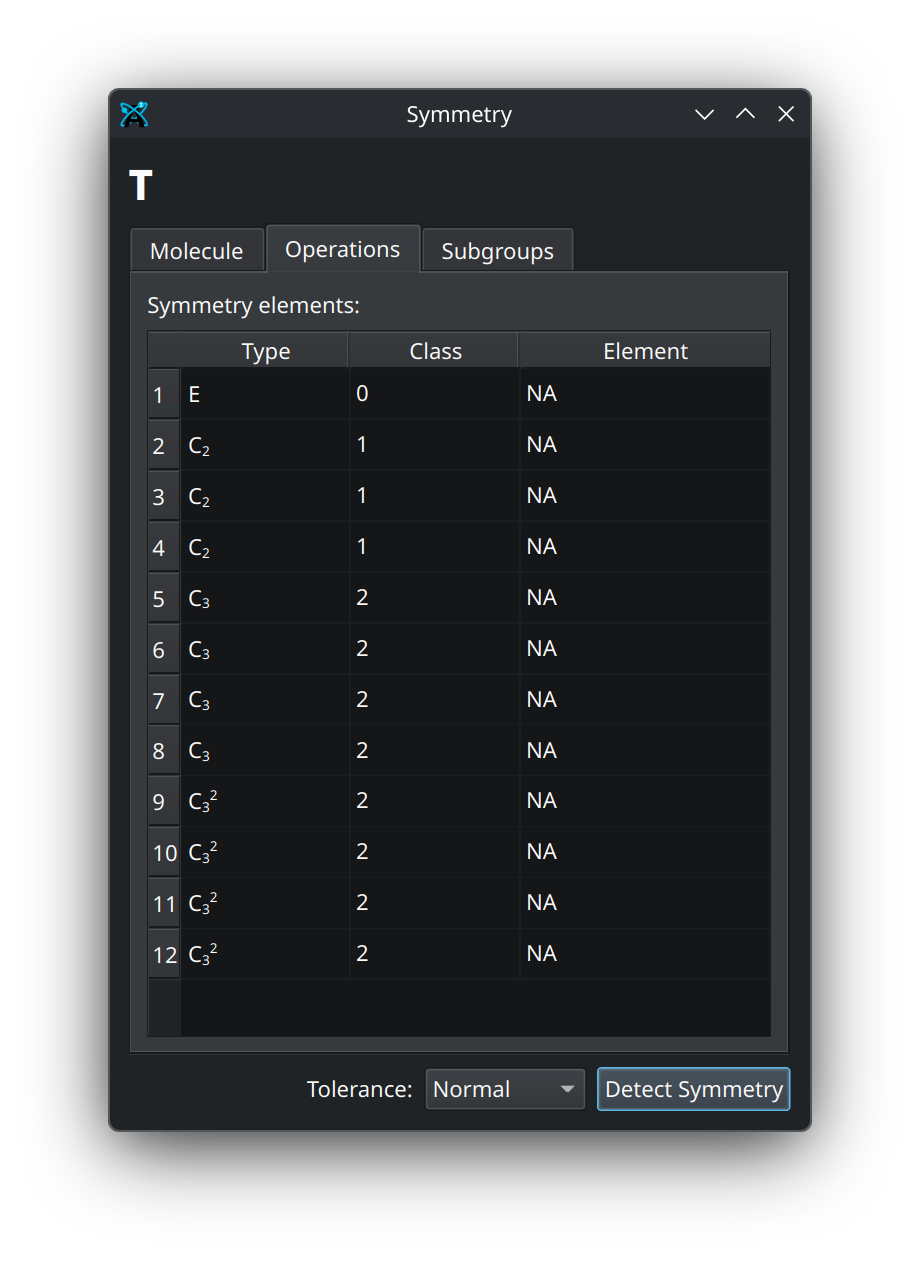
- Symmetry
Open the symmetry dialog, where you can access information about the molecule’s point group, visualize symmetry operations, and identify symmetry-equivalent atoms.
Symmetry Dialog
Surfaces Dialog#
The surfaces dialog has several useful tools for calculating and rendering various types of surfaces.
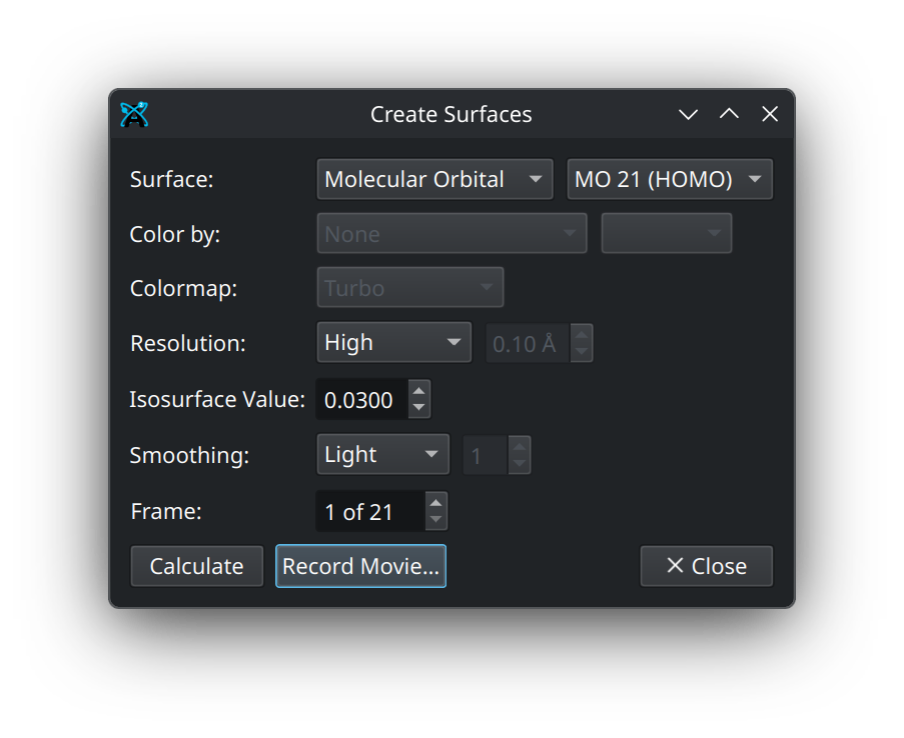
Surface Types and Coloring#
You can choose to render several surfaces from the first dropdown, including a Van der Waals surface, solvent accessible and solvent excluded surfaces, molecular orbitals, and electron density. The latter two require an output from a quantum calculation.
For any surface other than a molecular orbital, you can choose to color the surface by the electrostatic potential, and select from several color maps.
Available Color Maps


Resolution#
The resolution option sets the spacing between volume elements in the rendered image.
Hint
While a higher resolution may be desirable, keep in mind that the time to compute the surface scales cubically!
Isosurface Value#
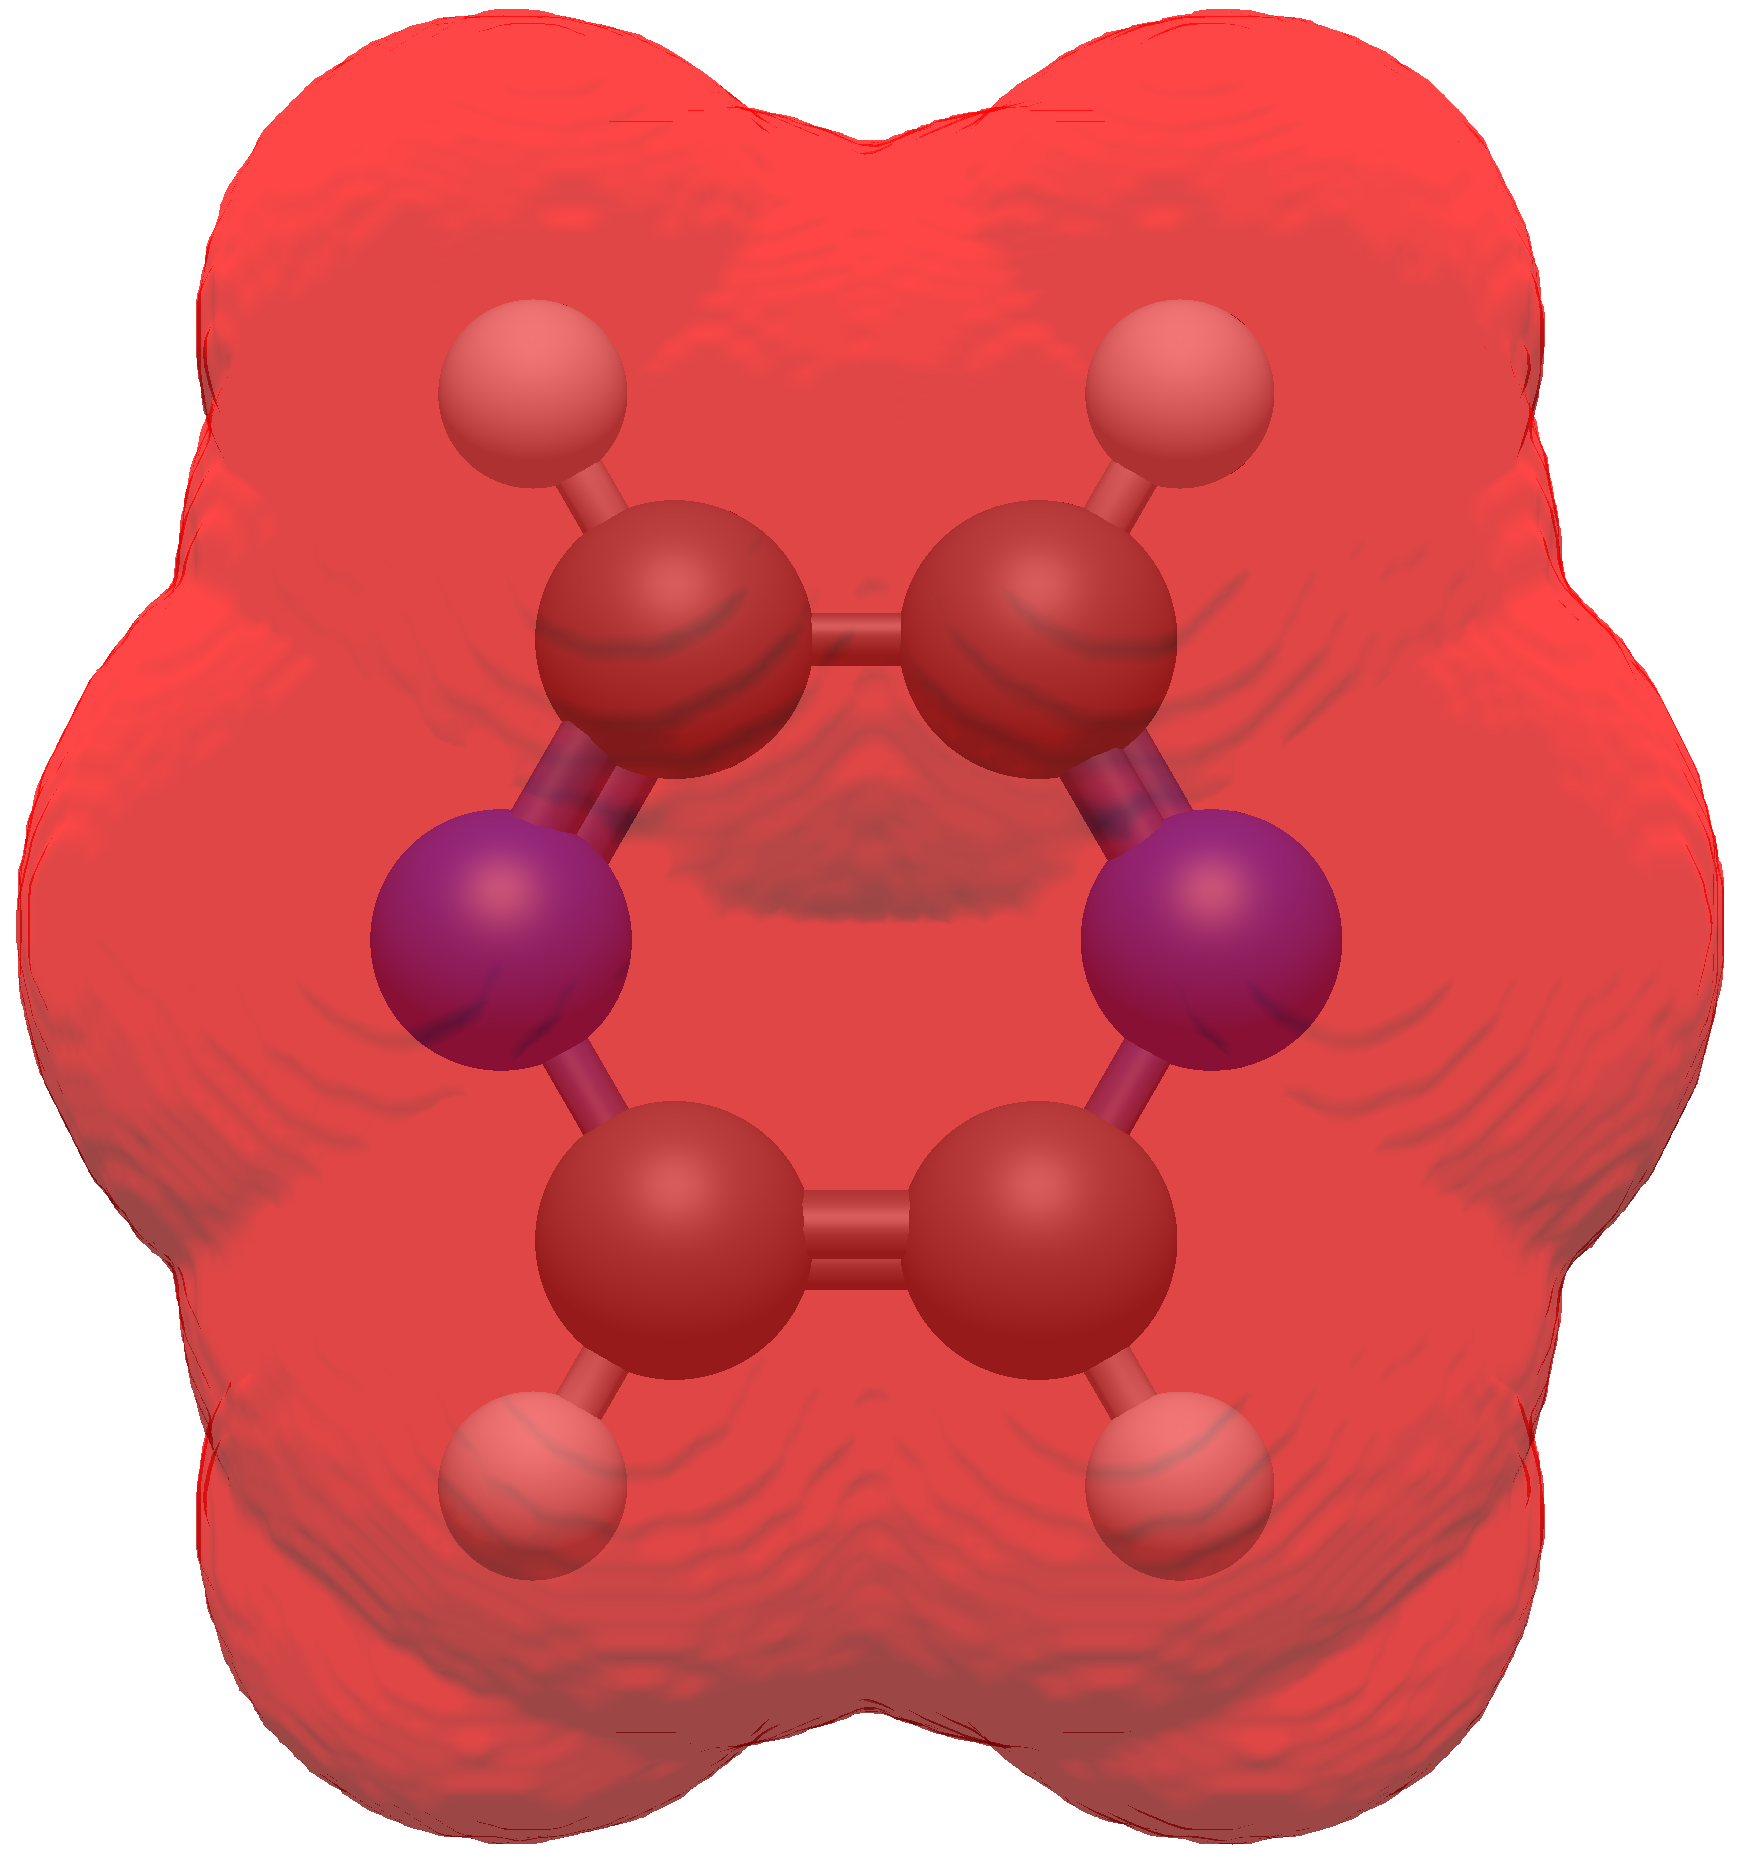
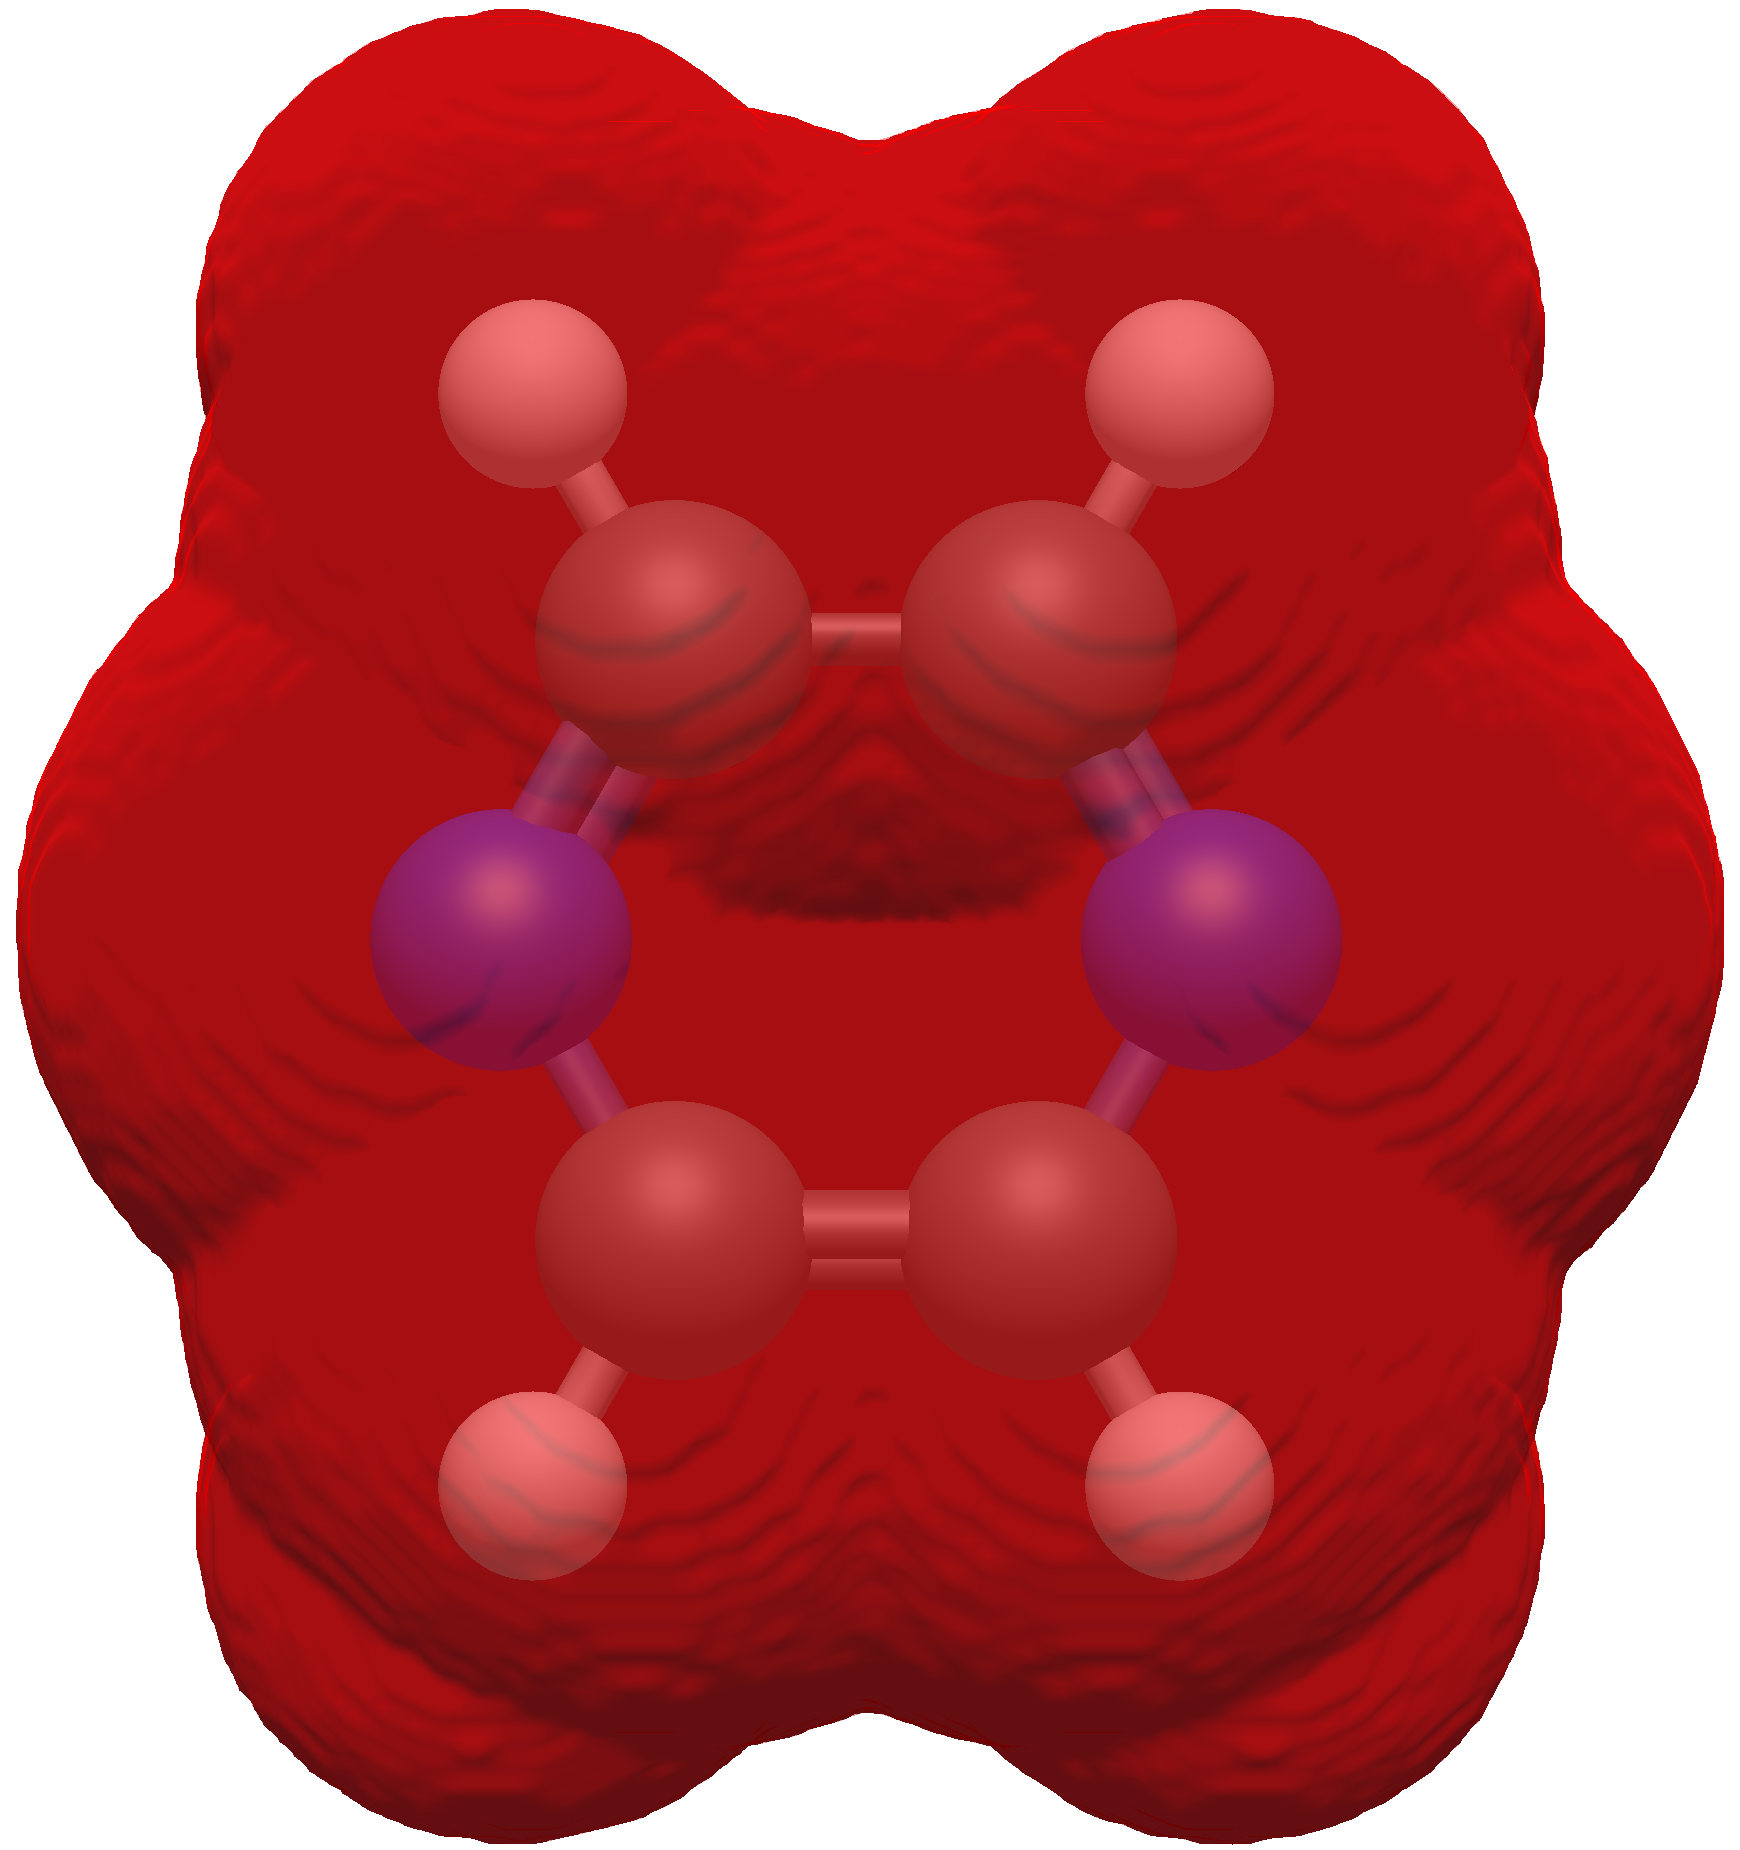
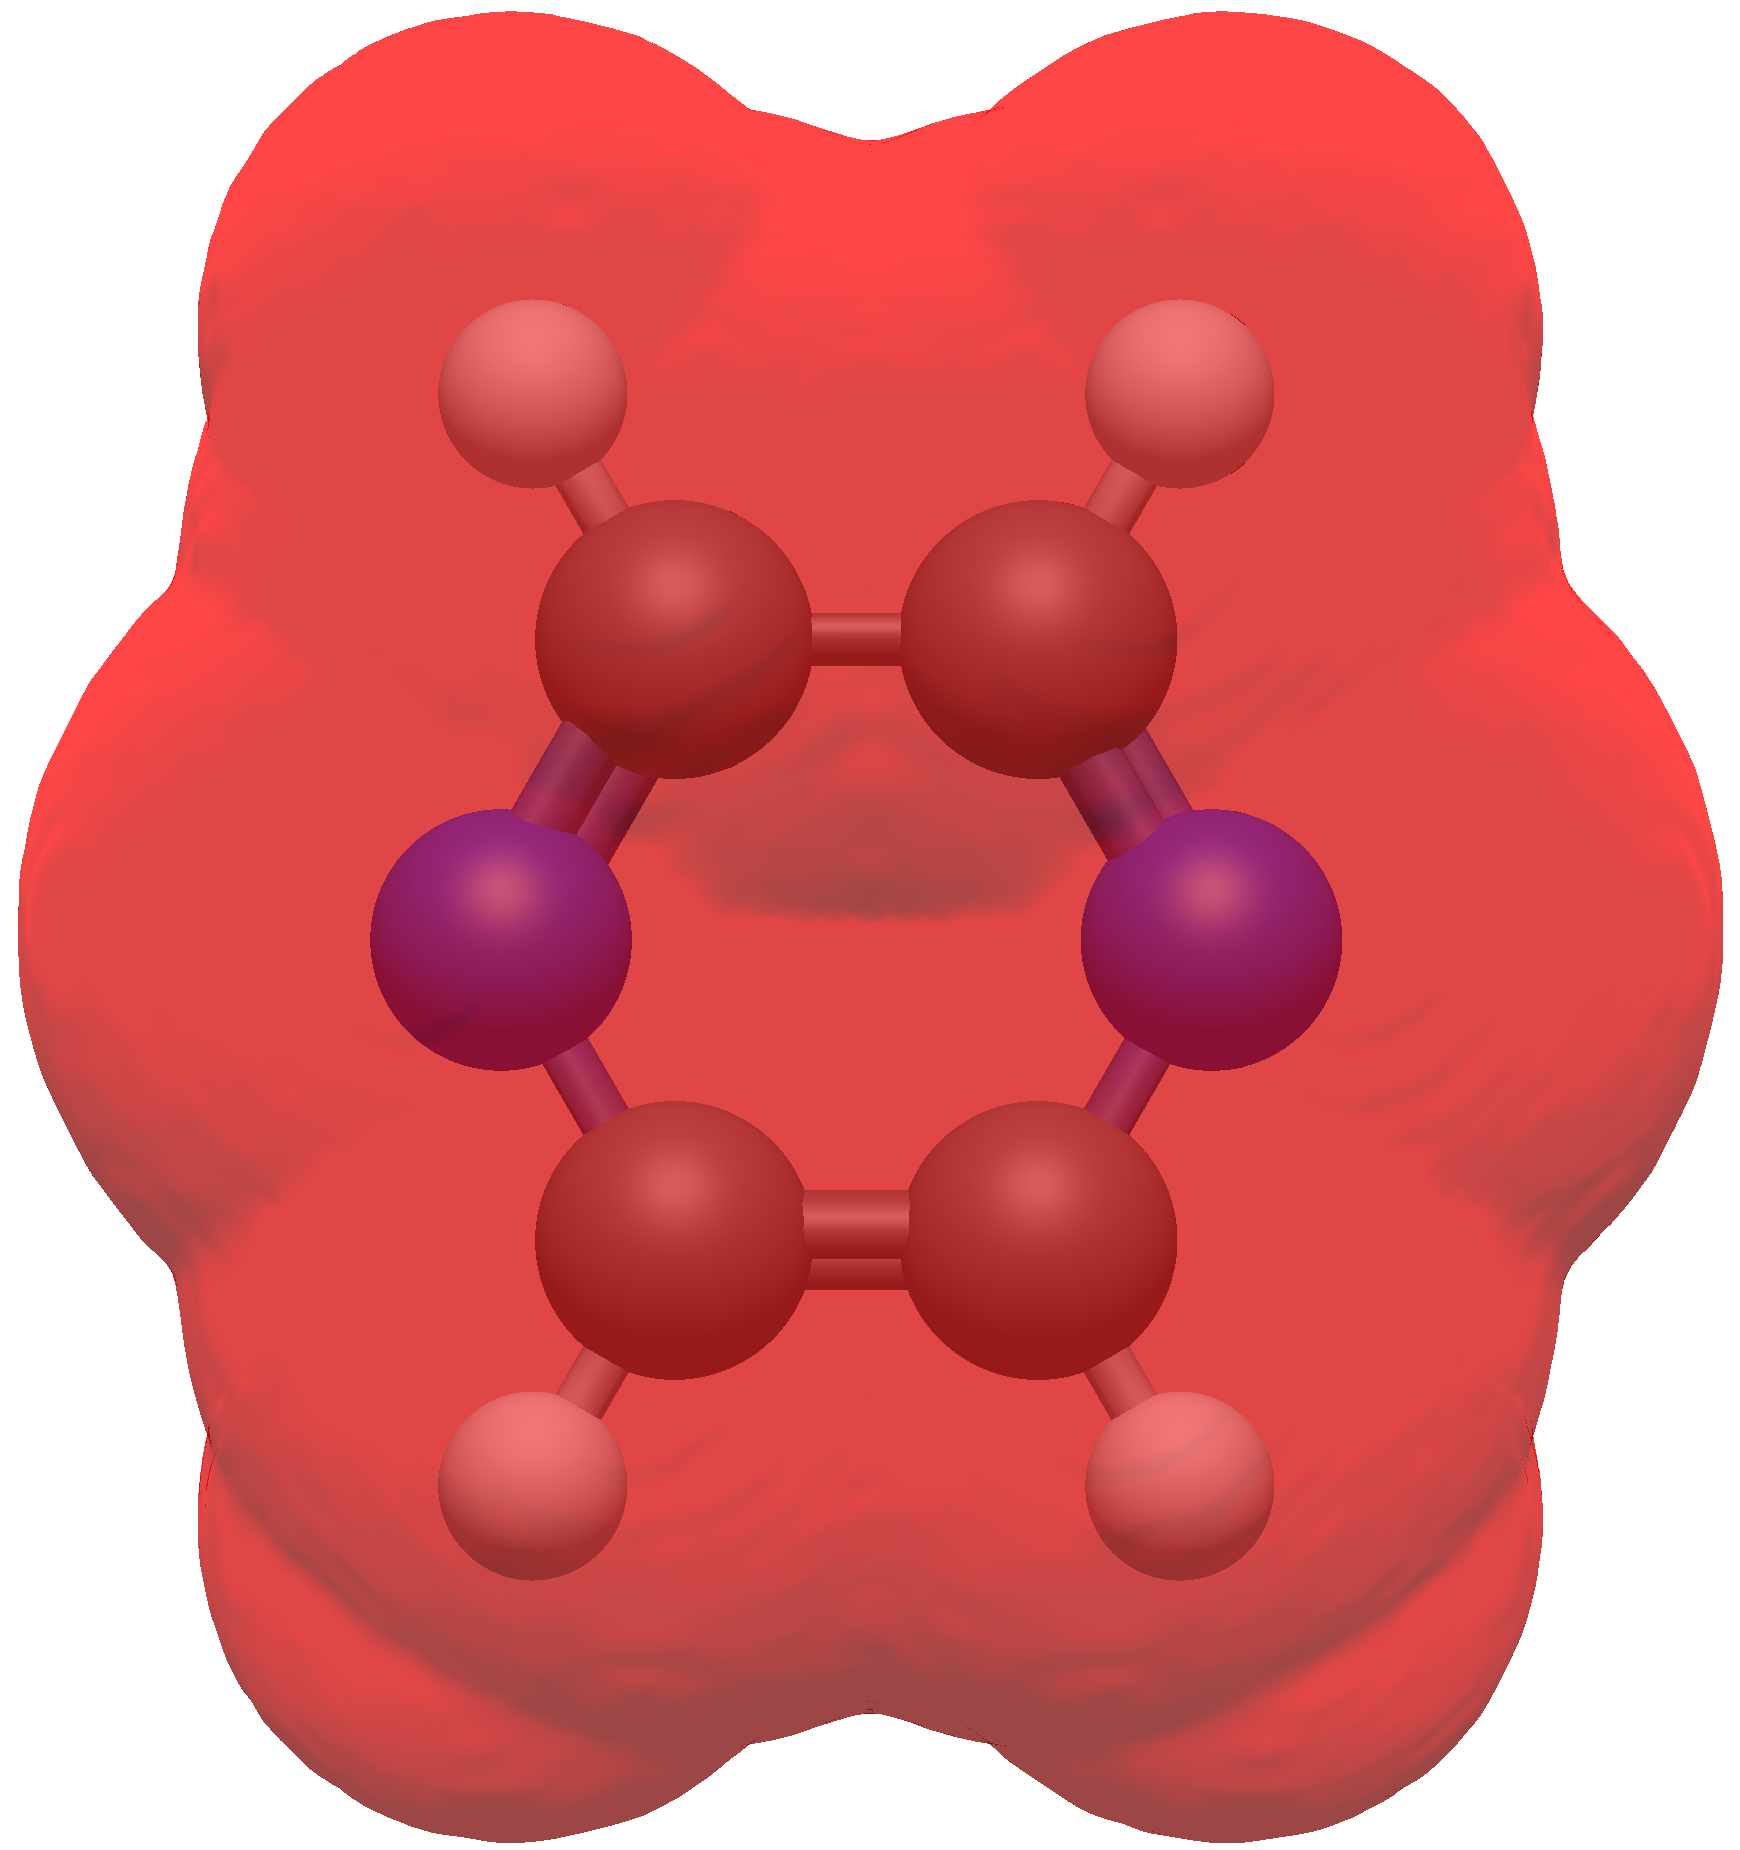
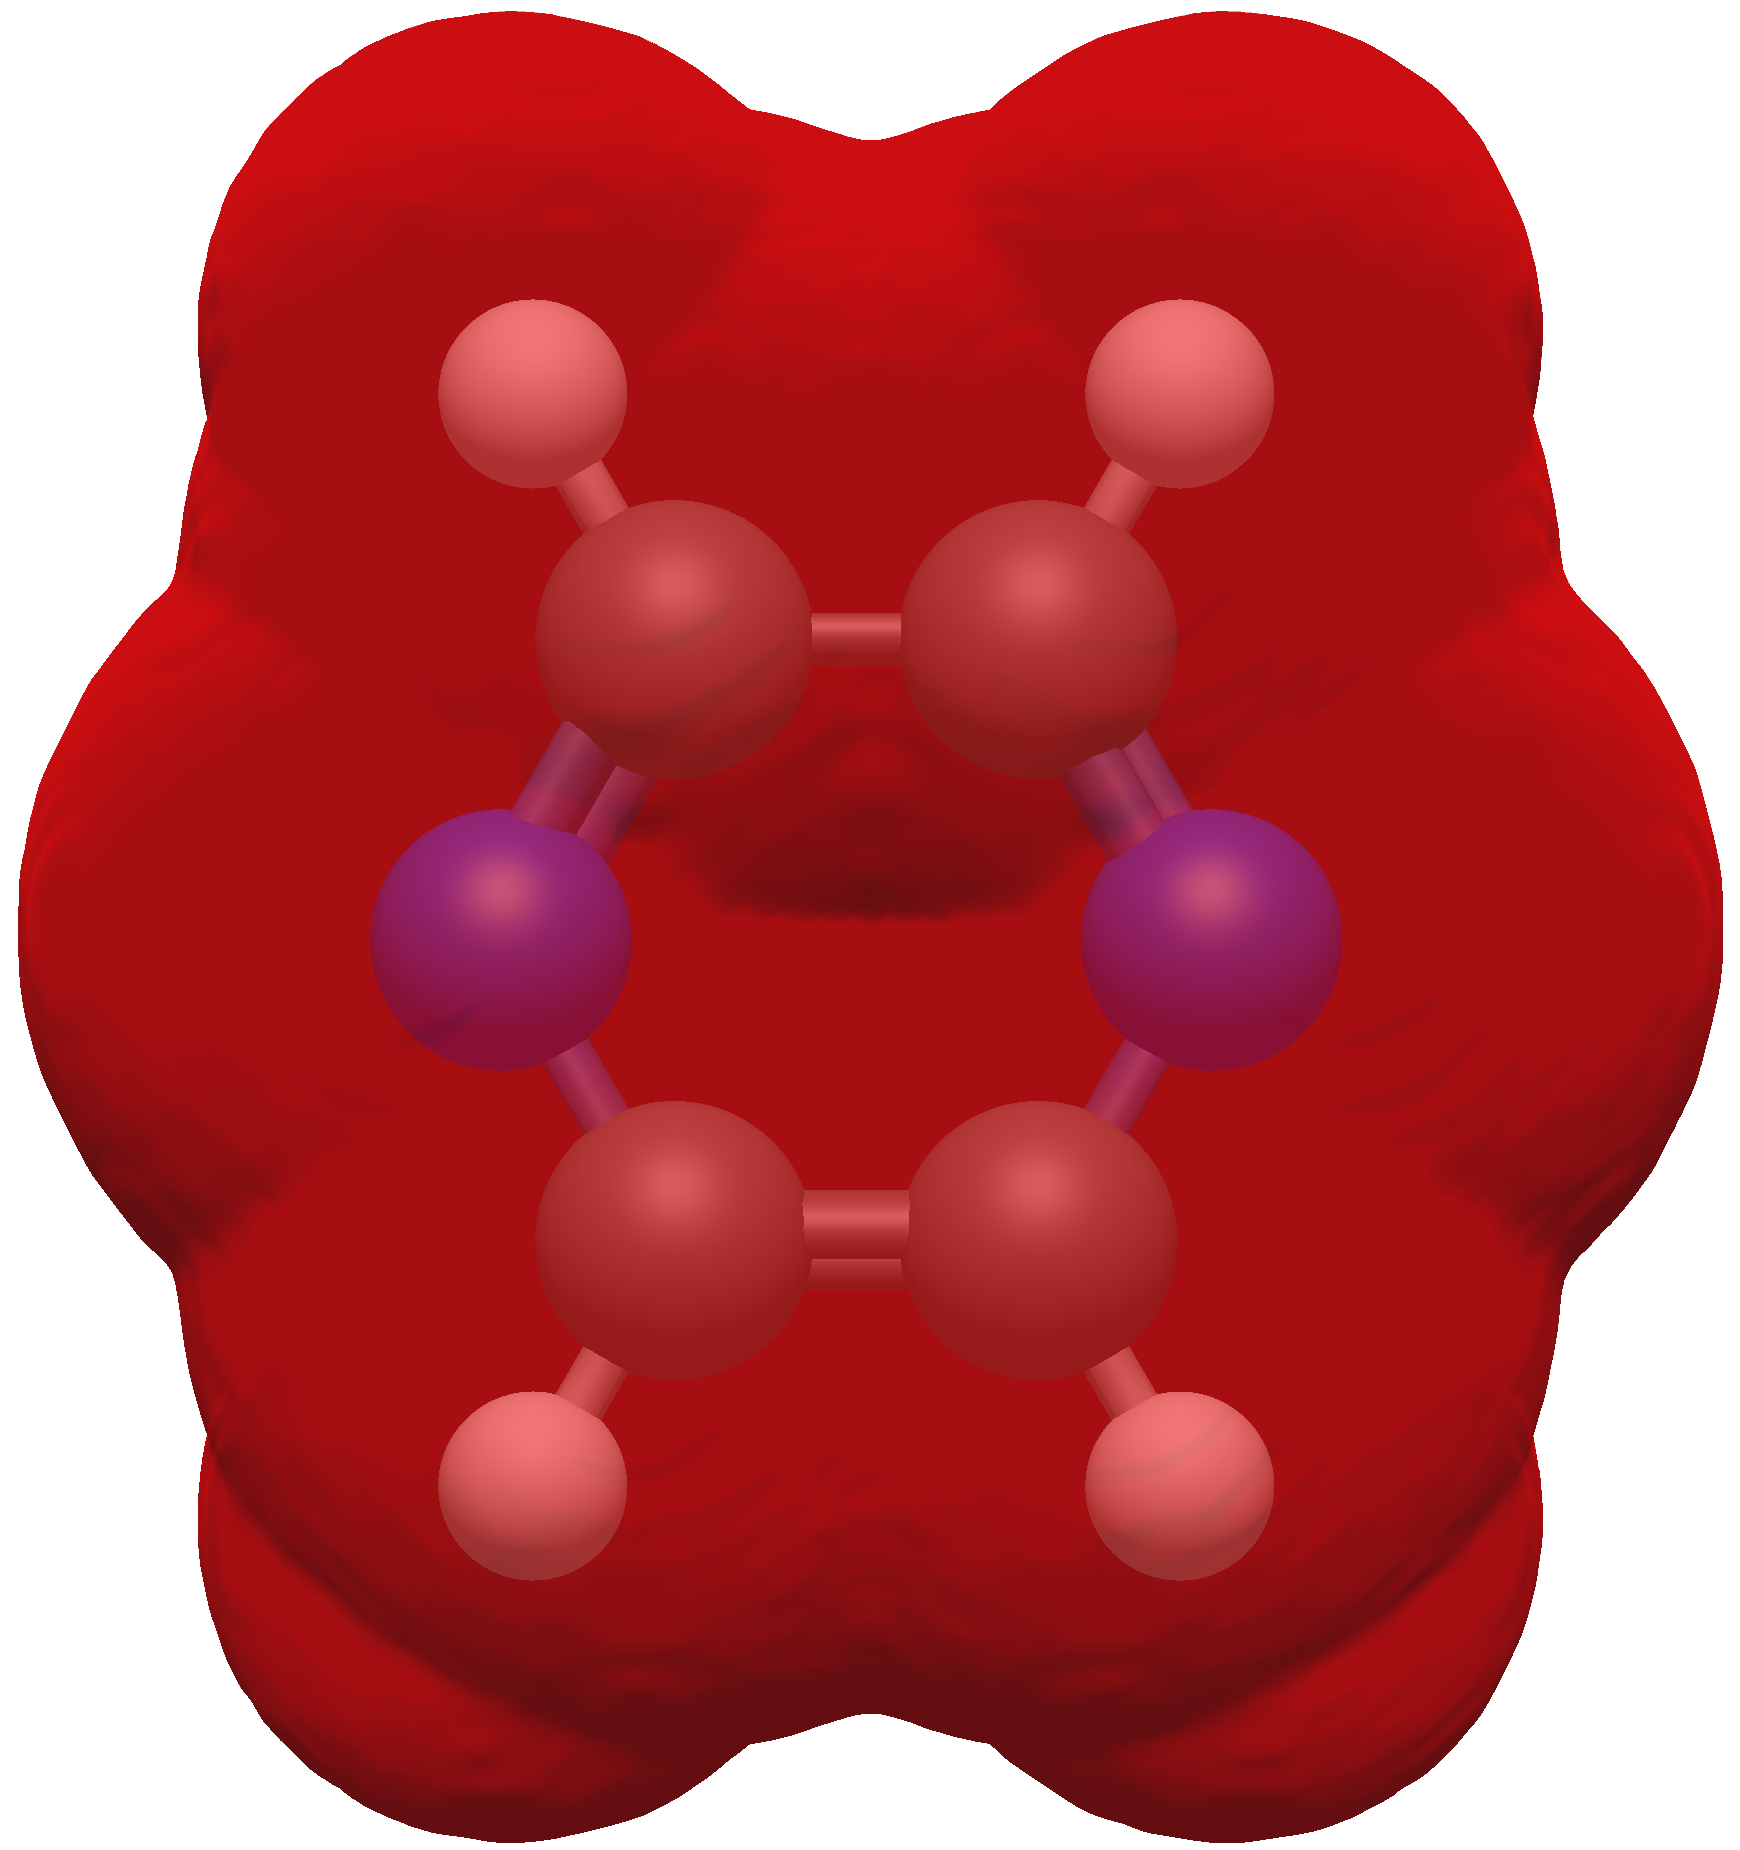
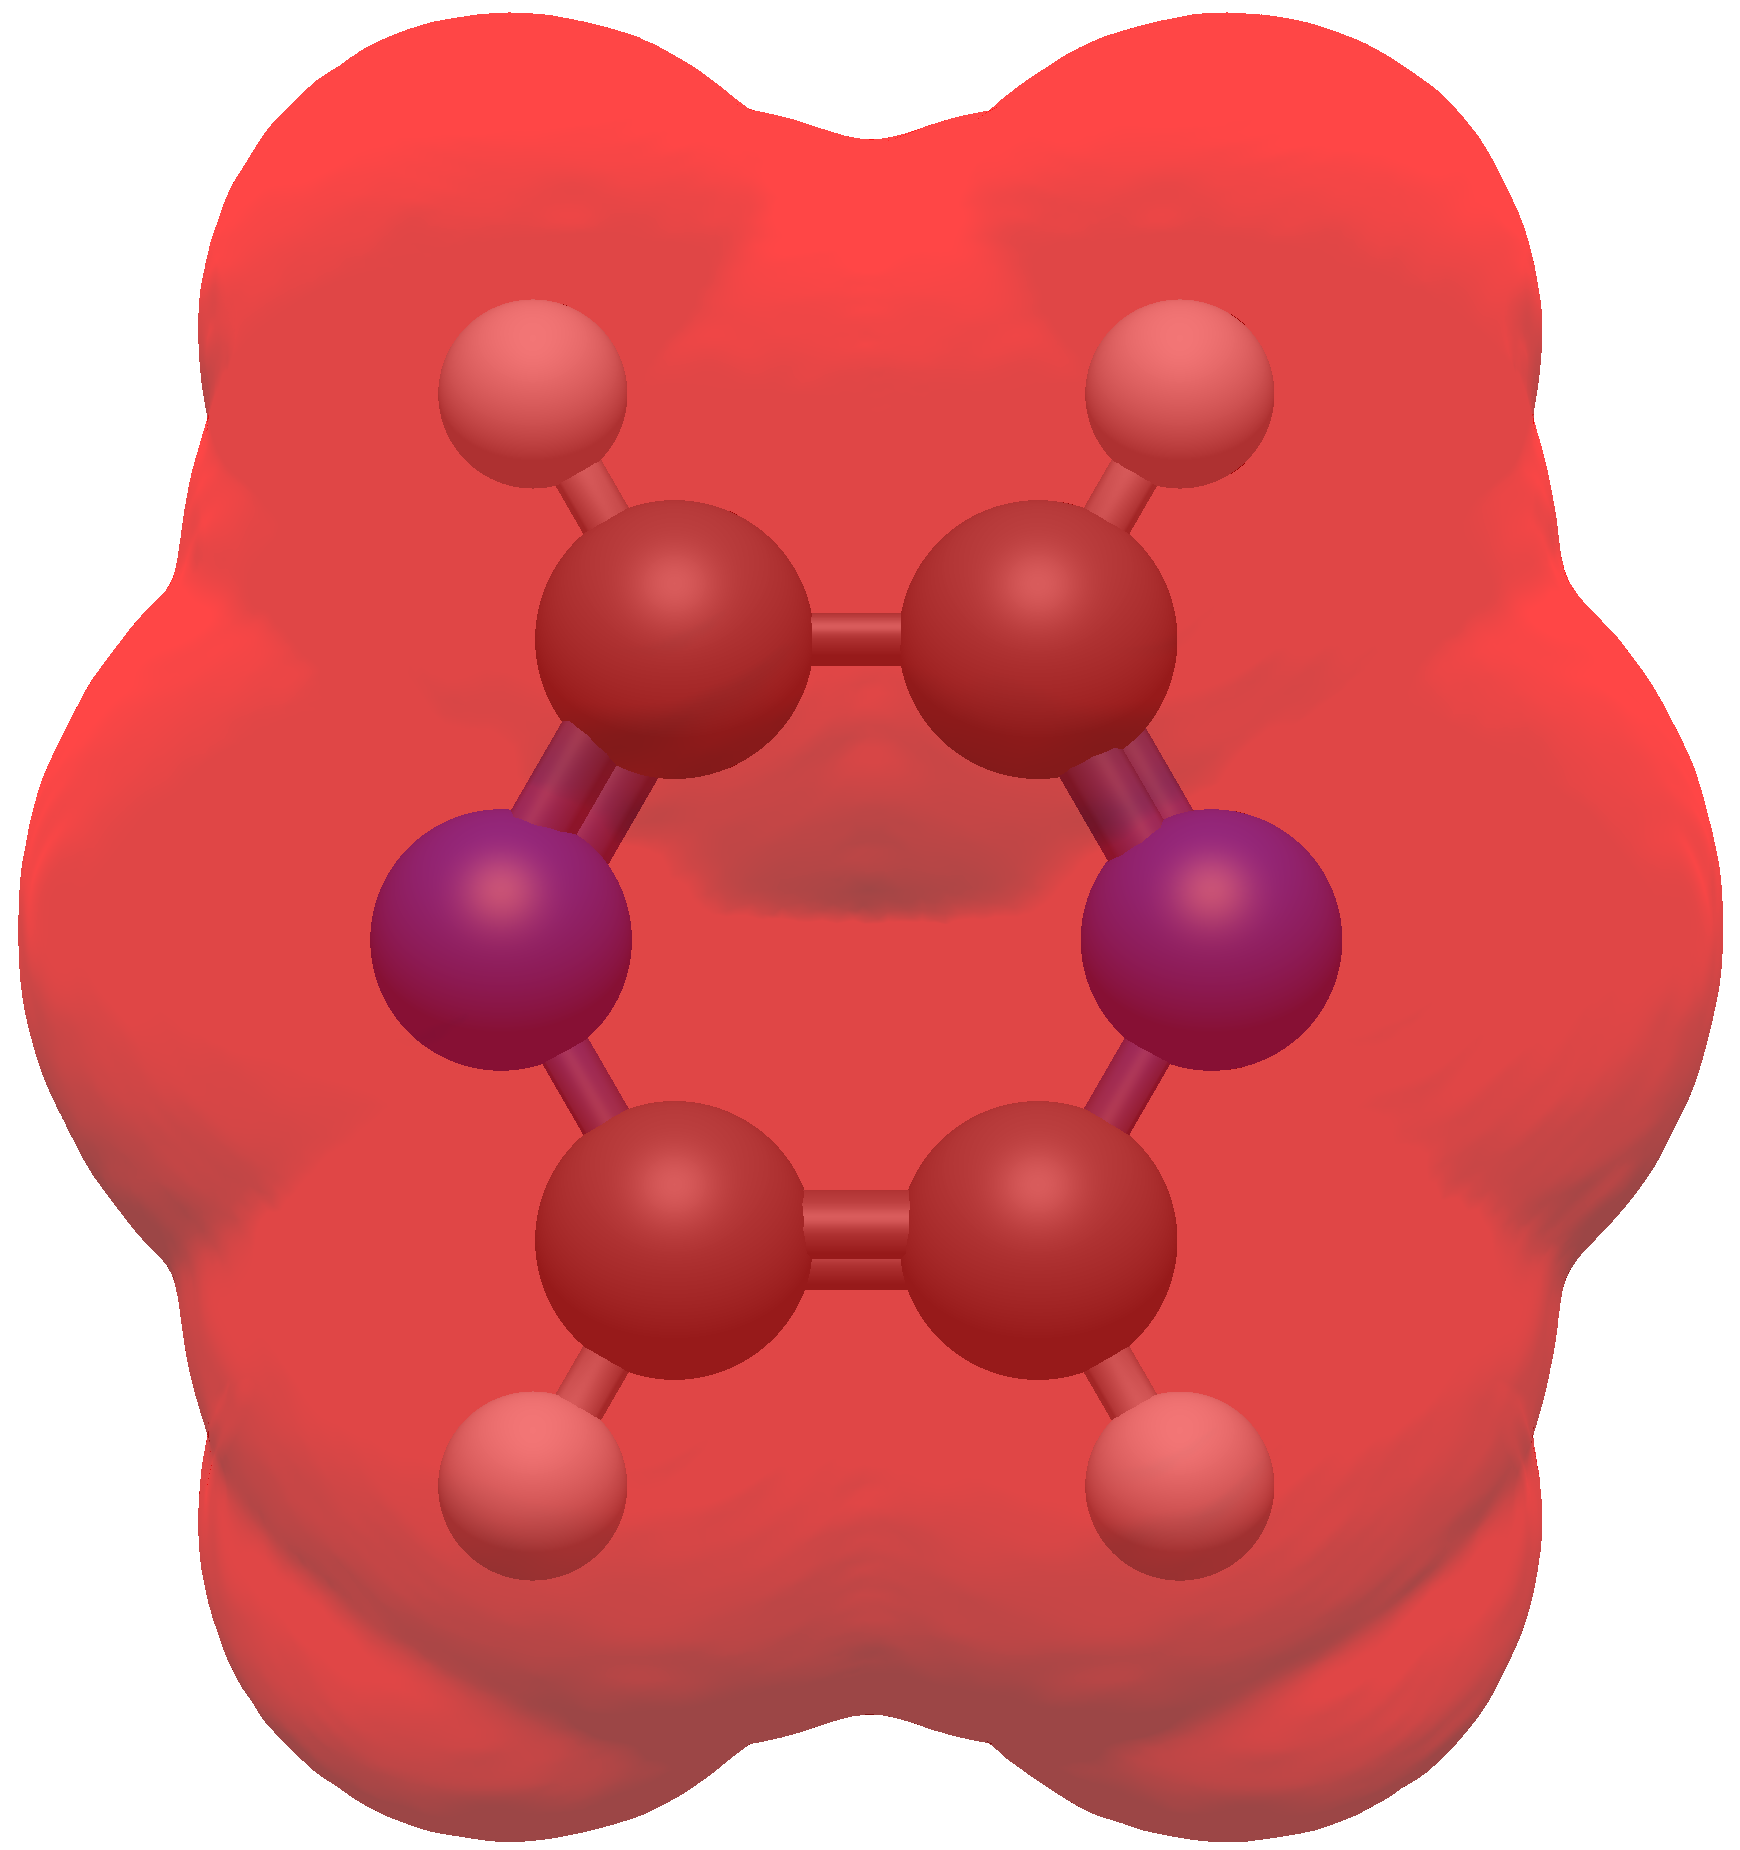
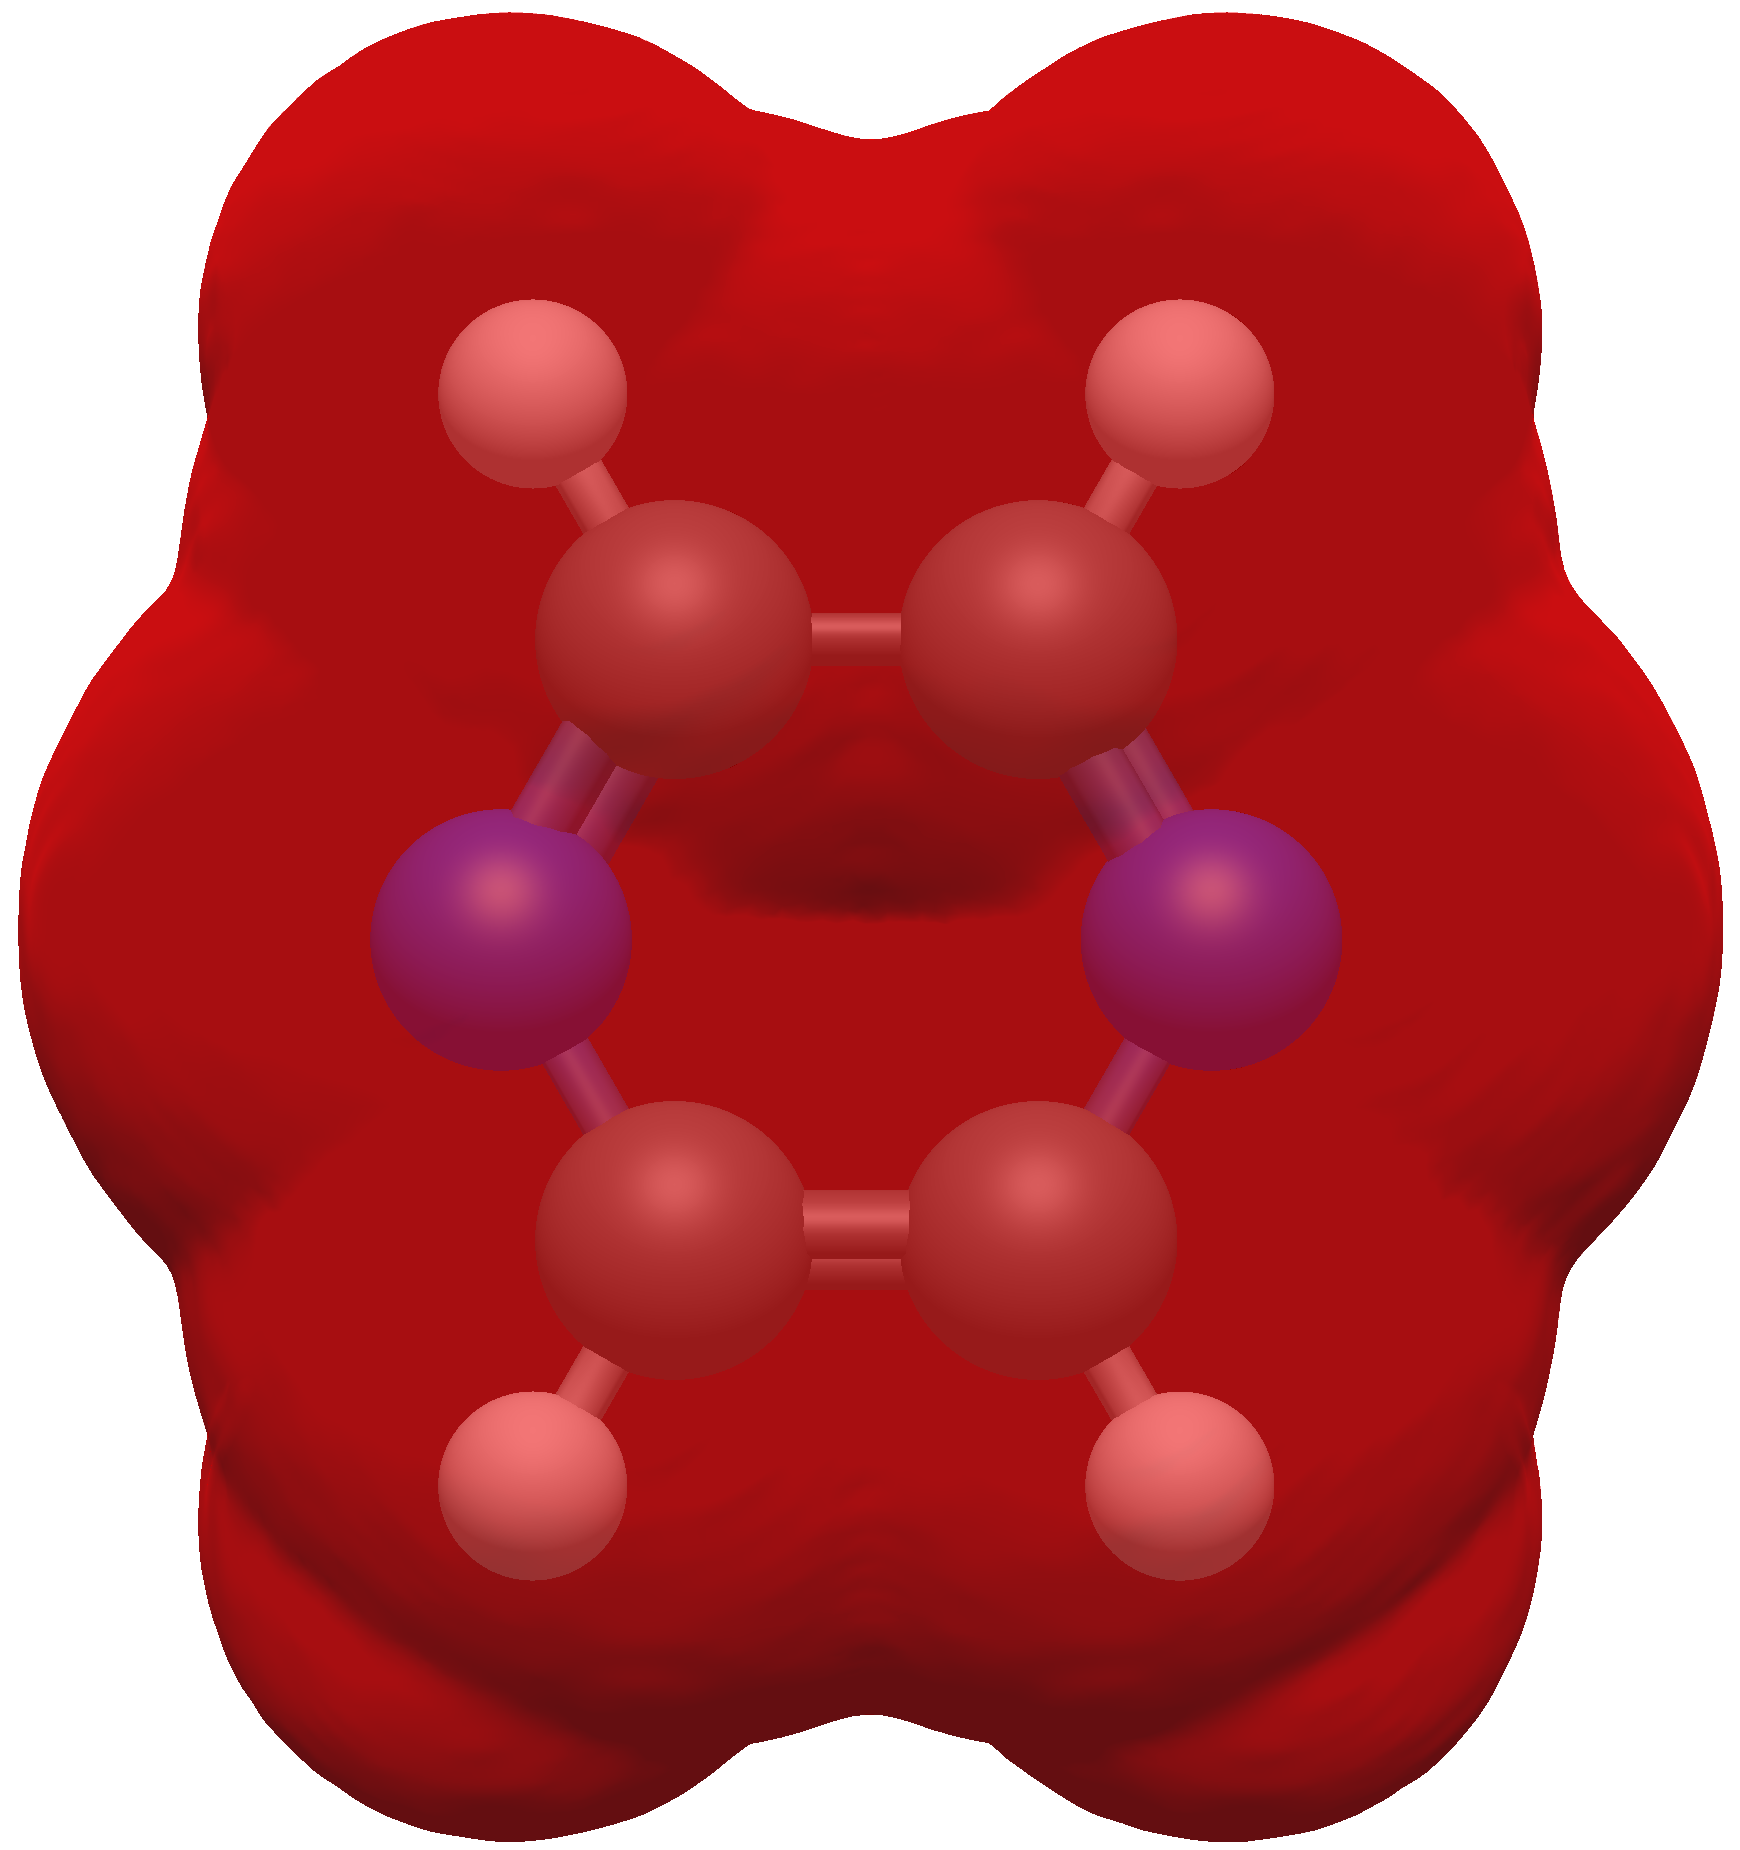
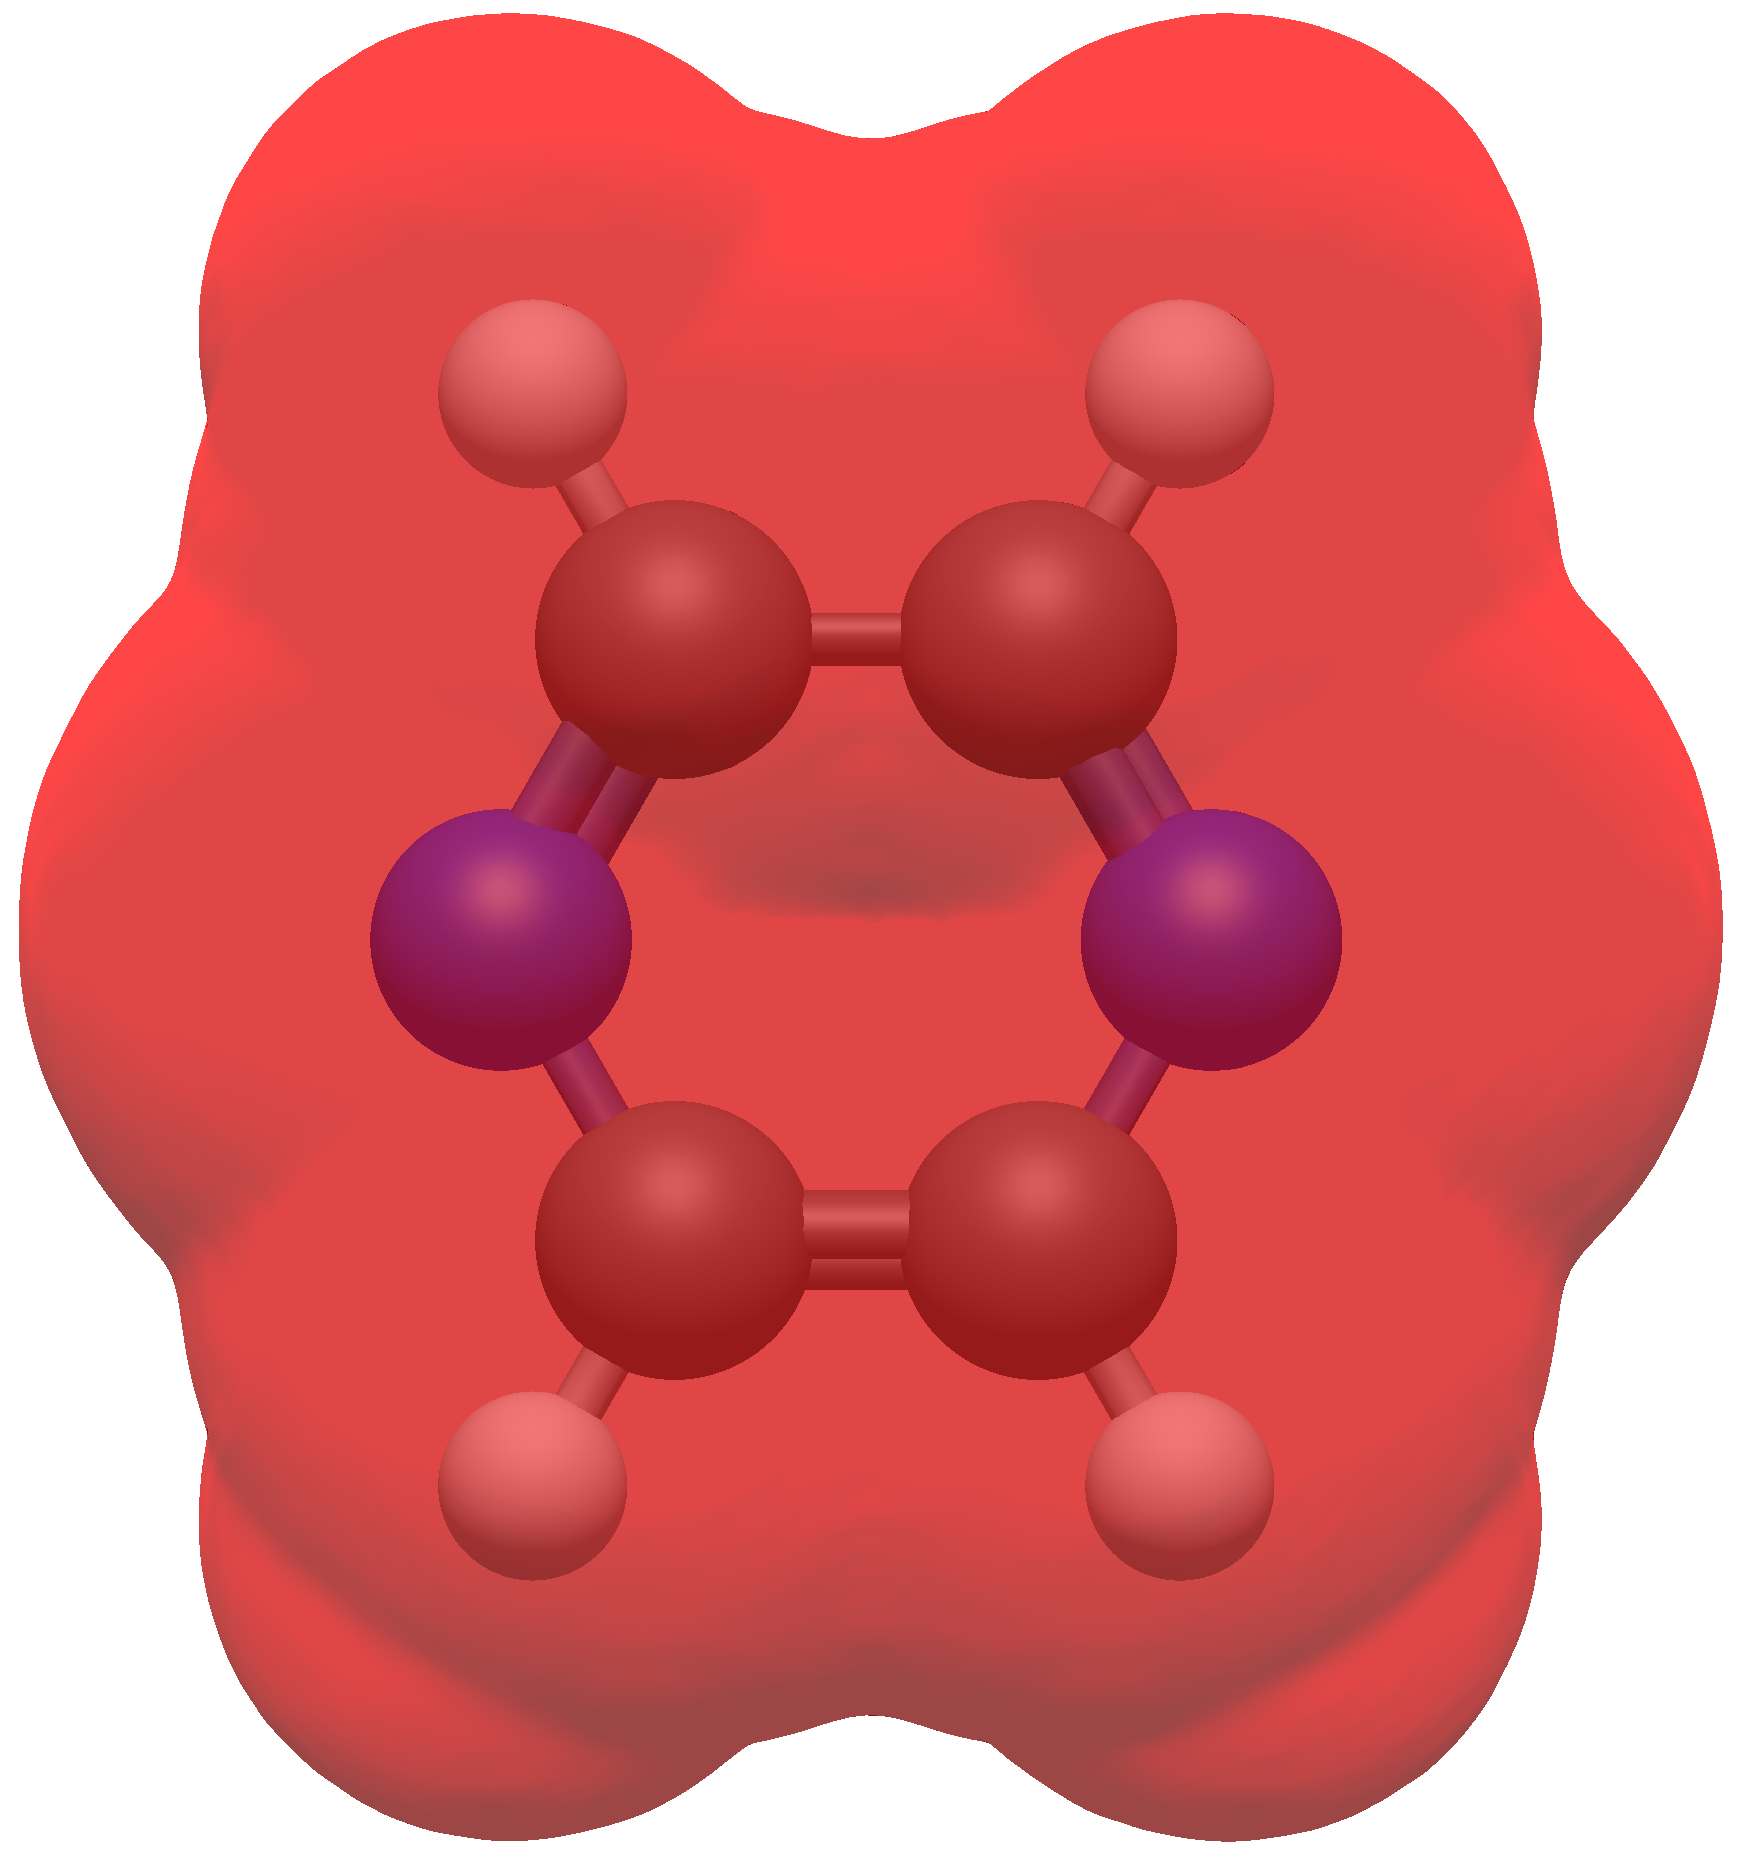
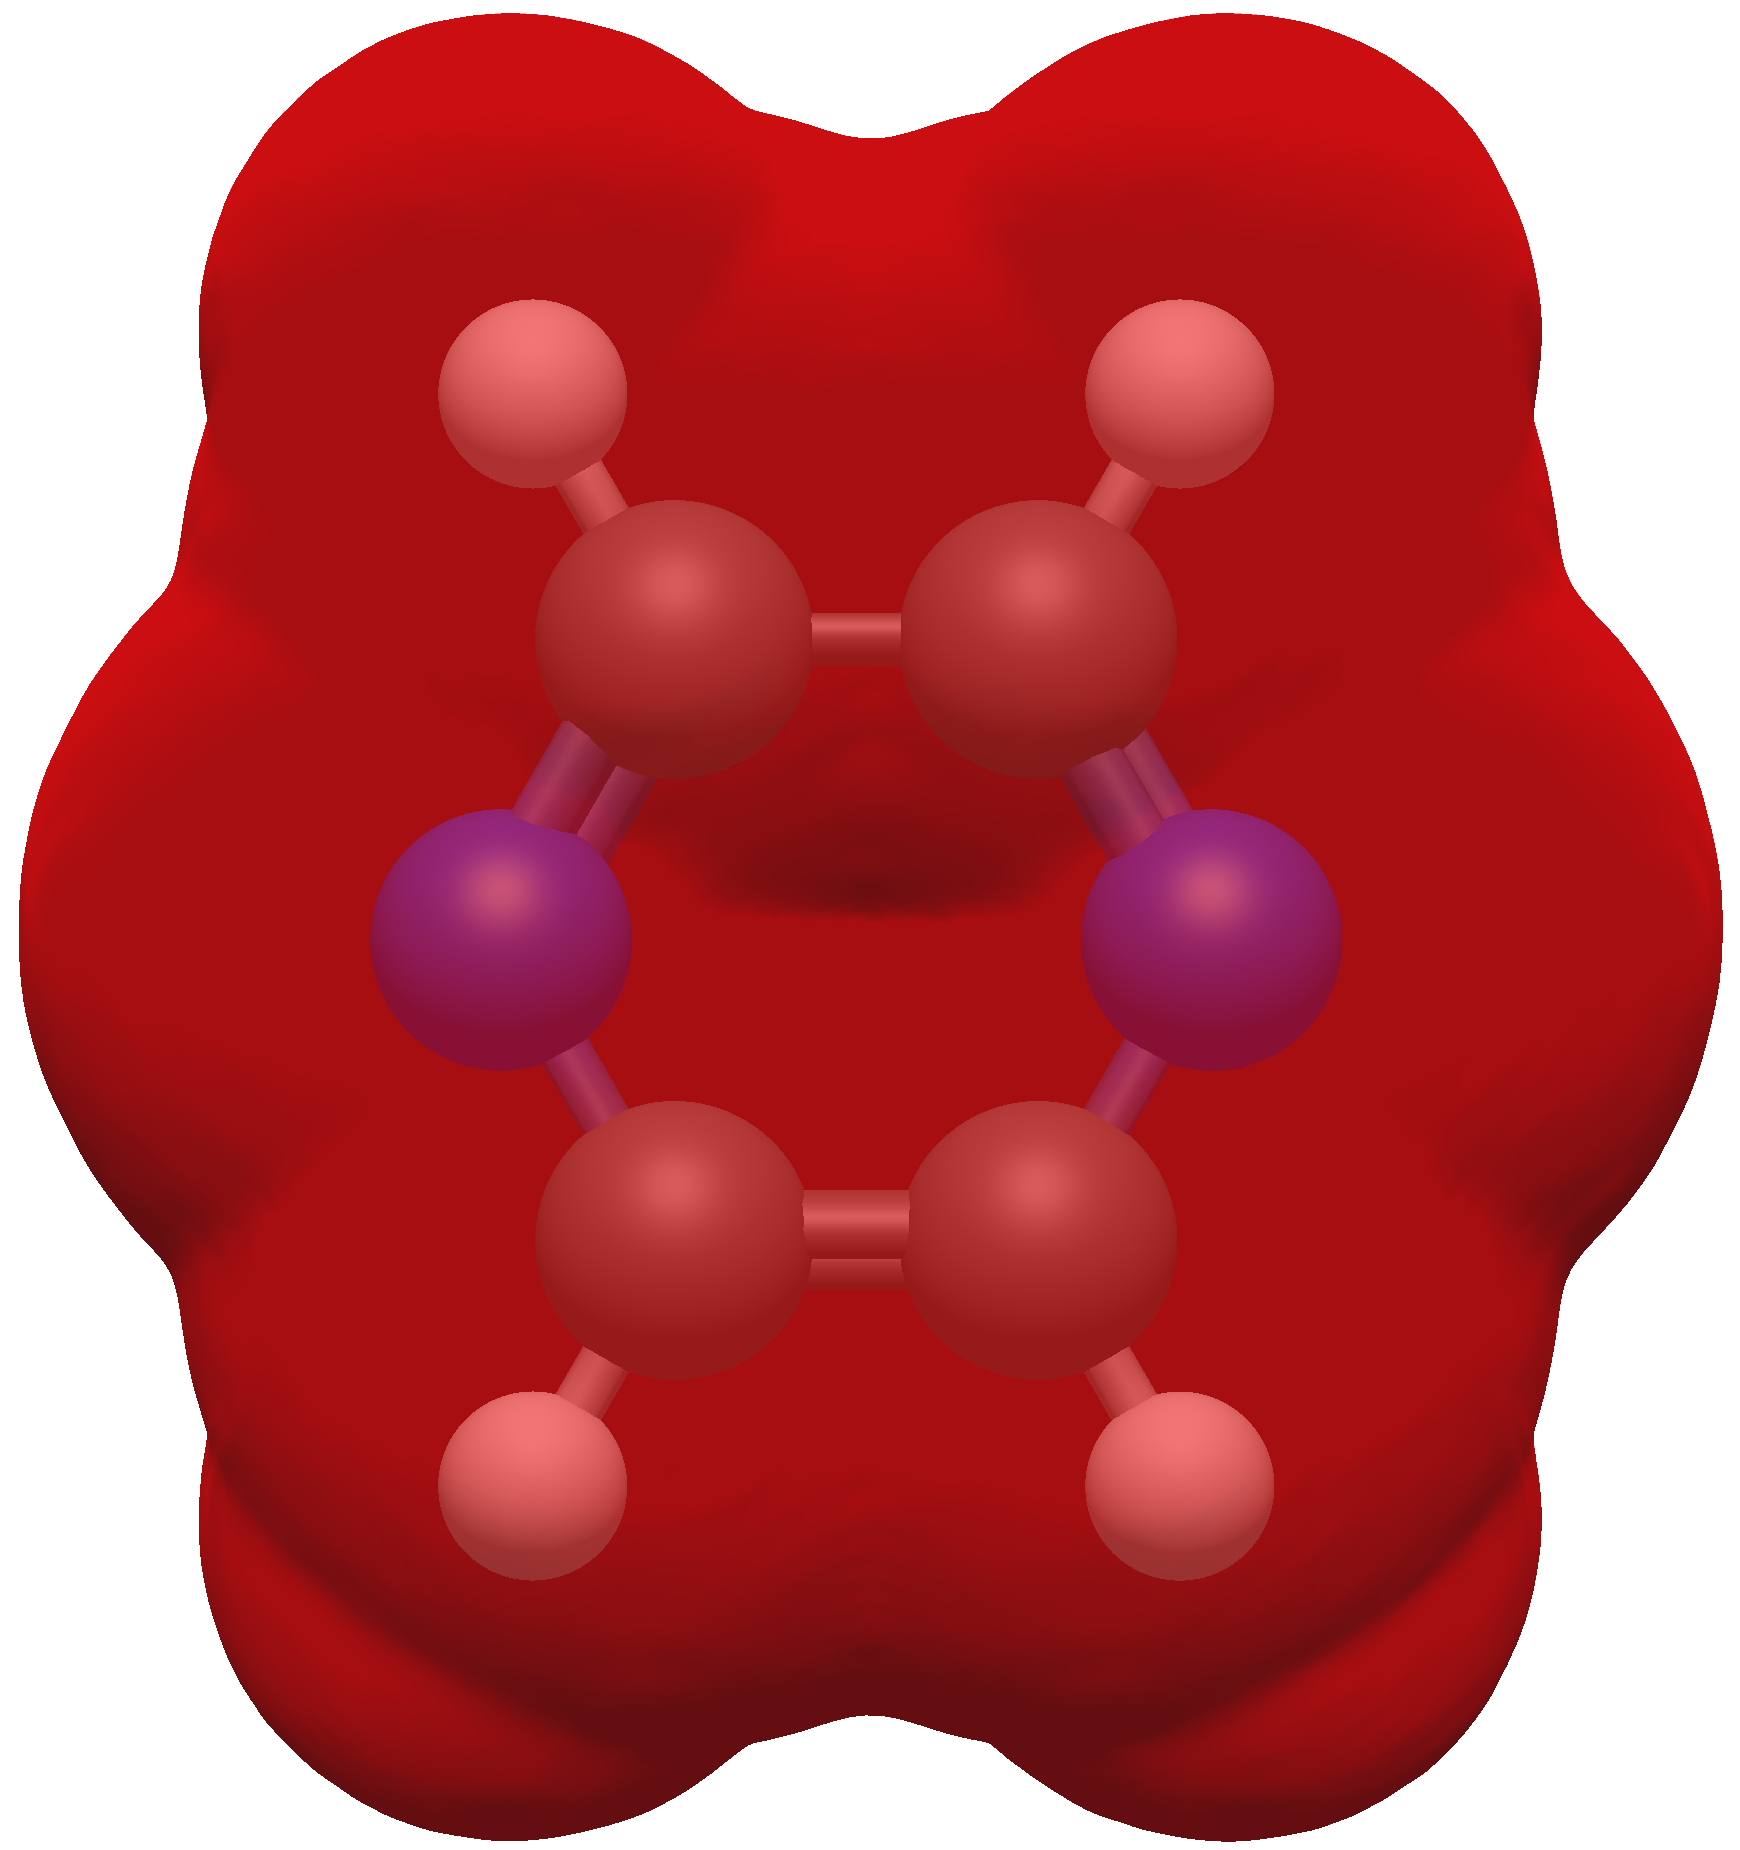
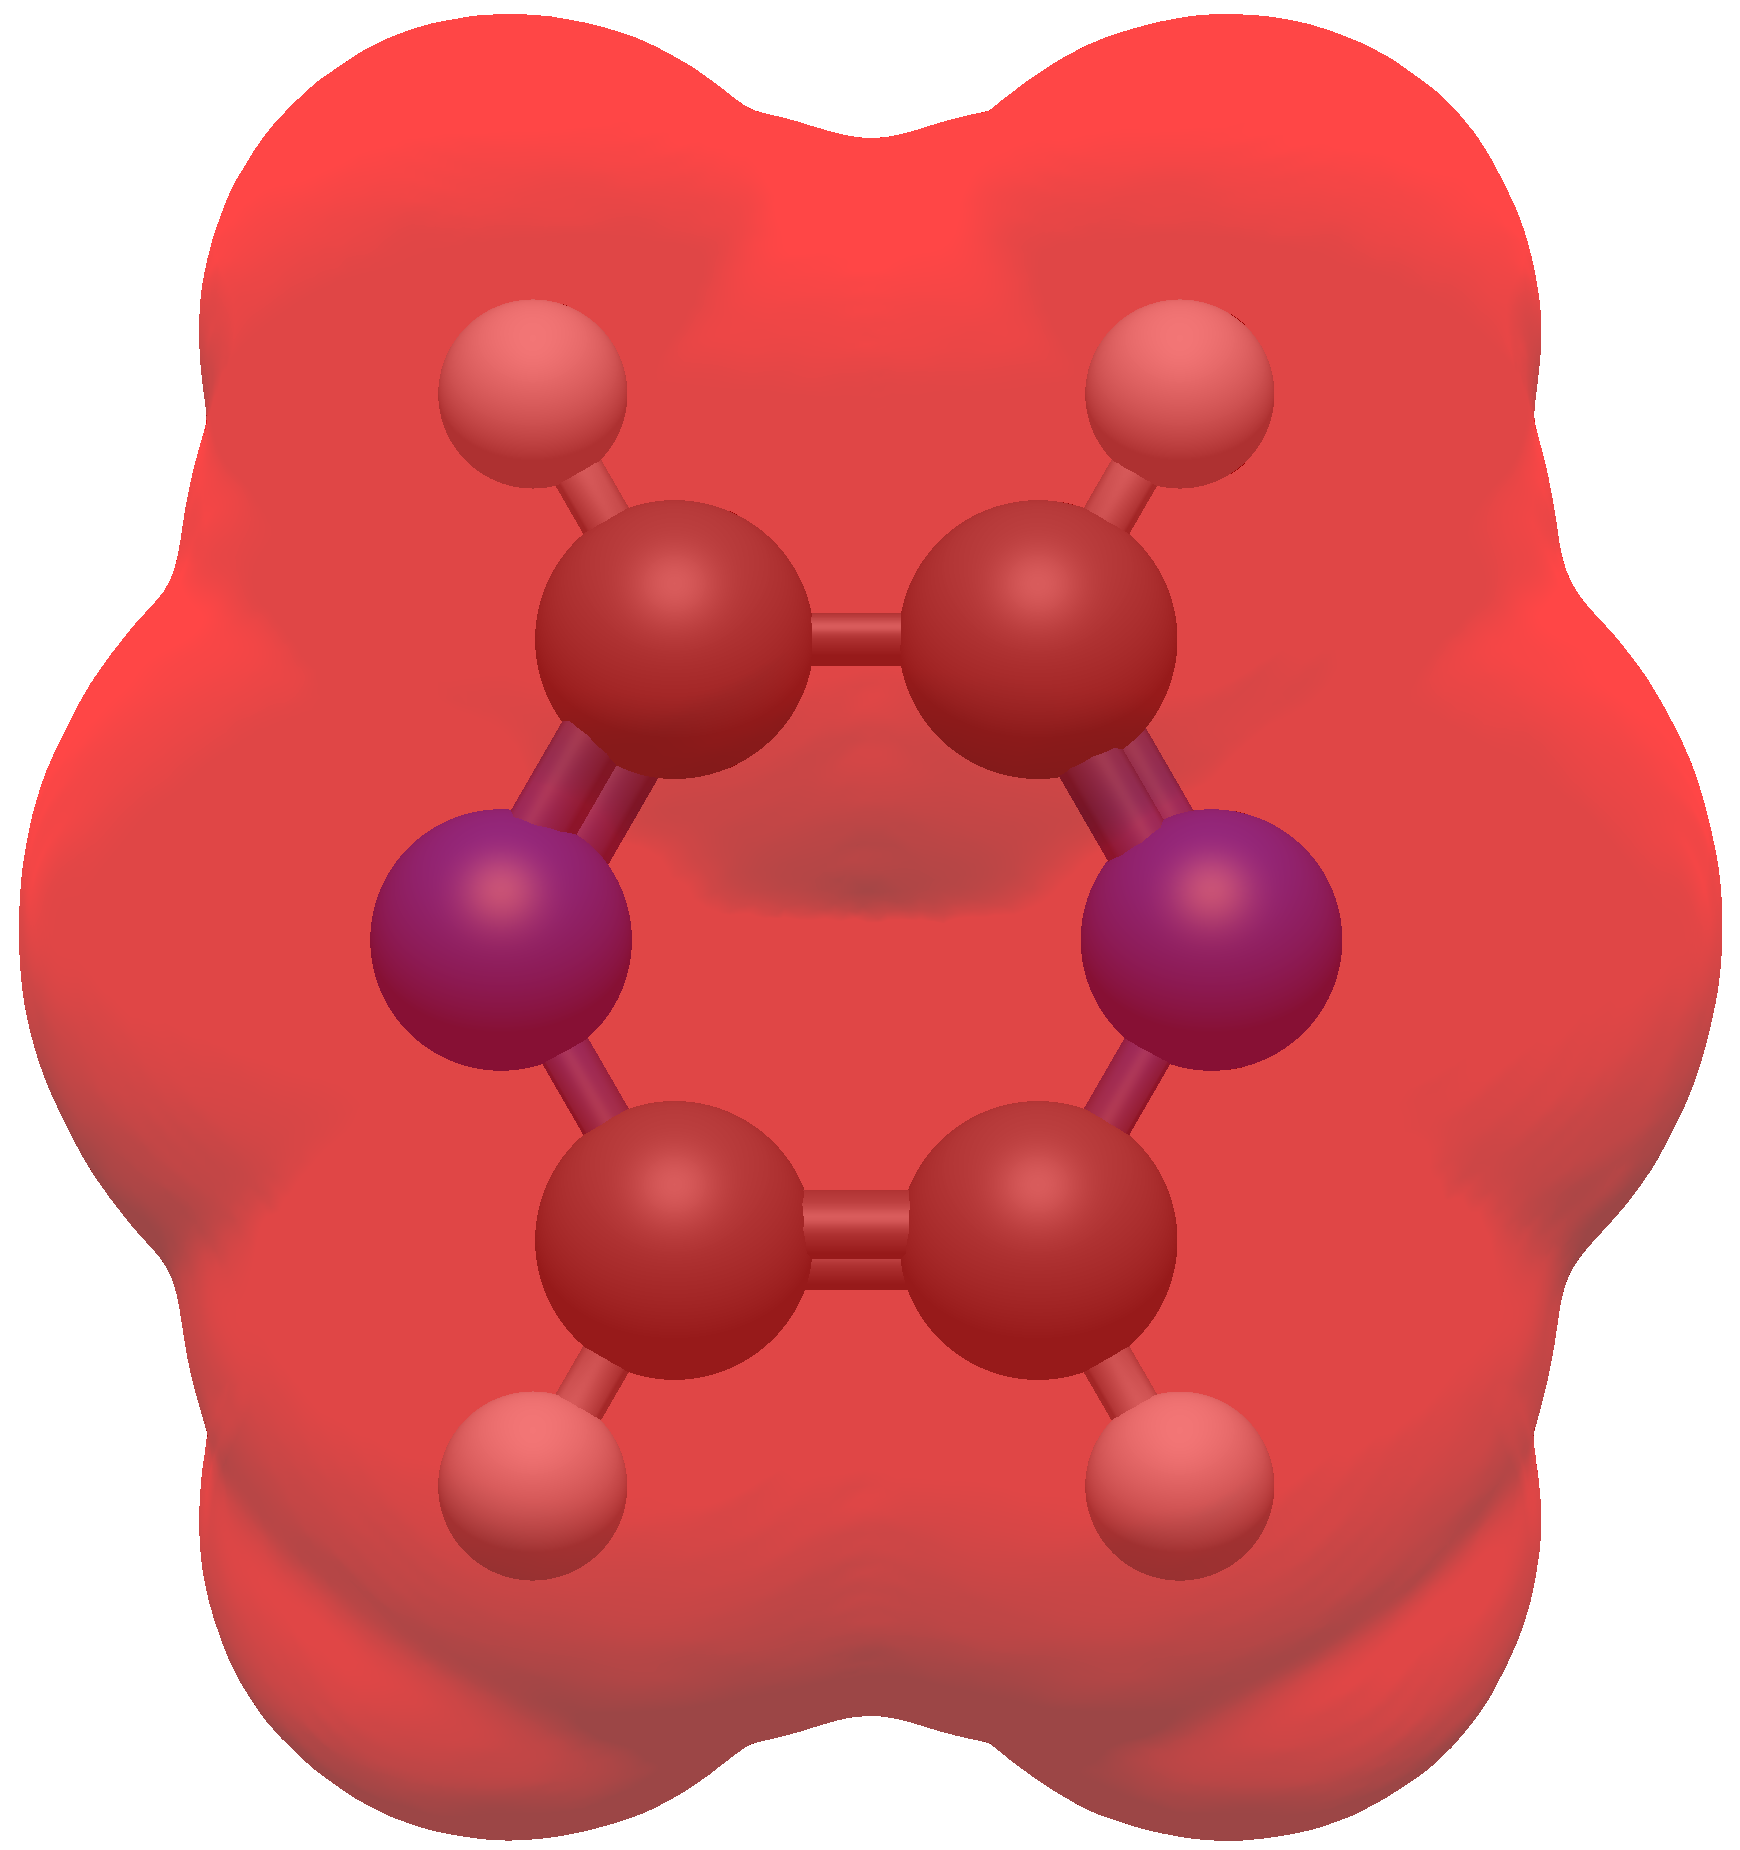
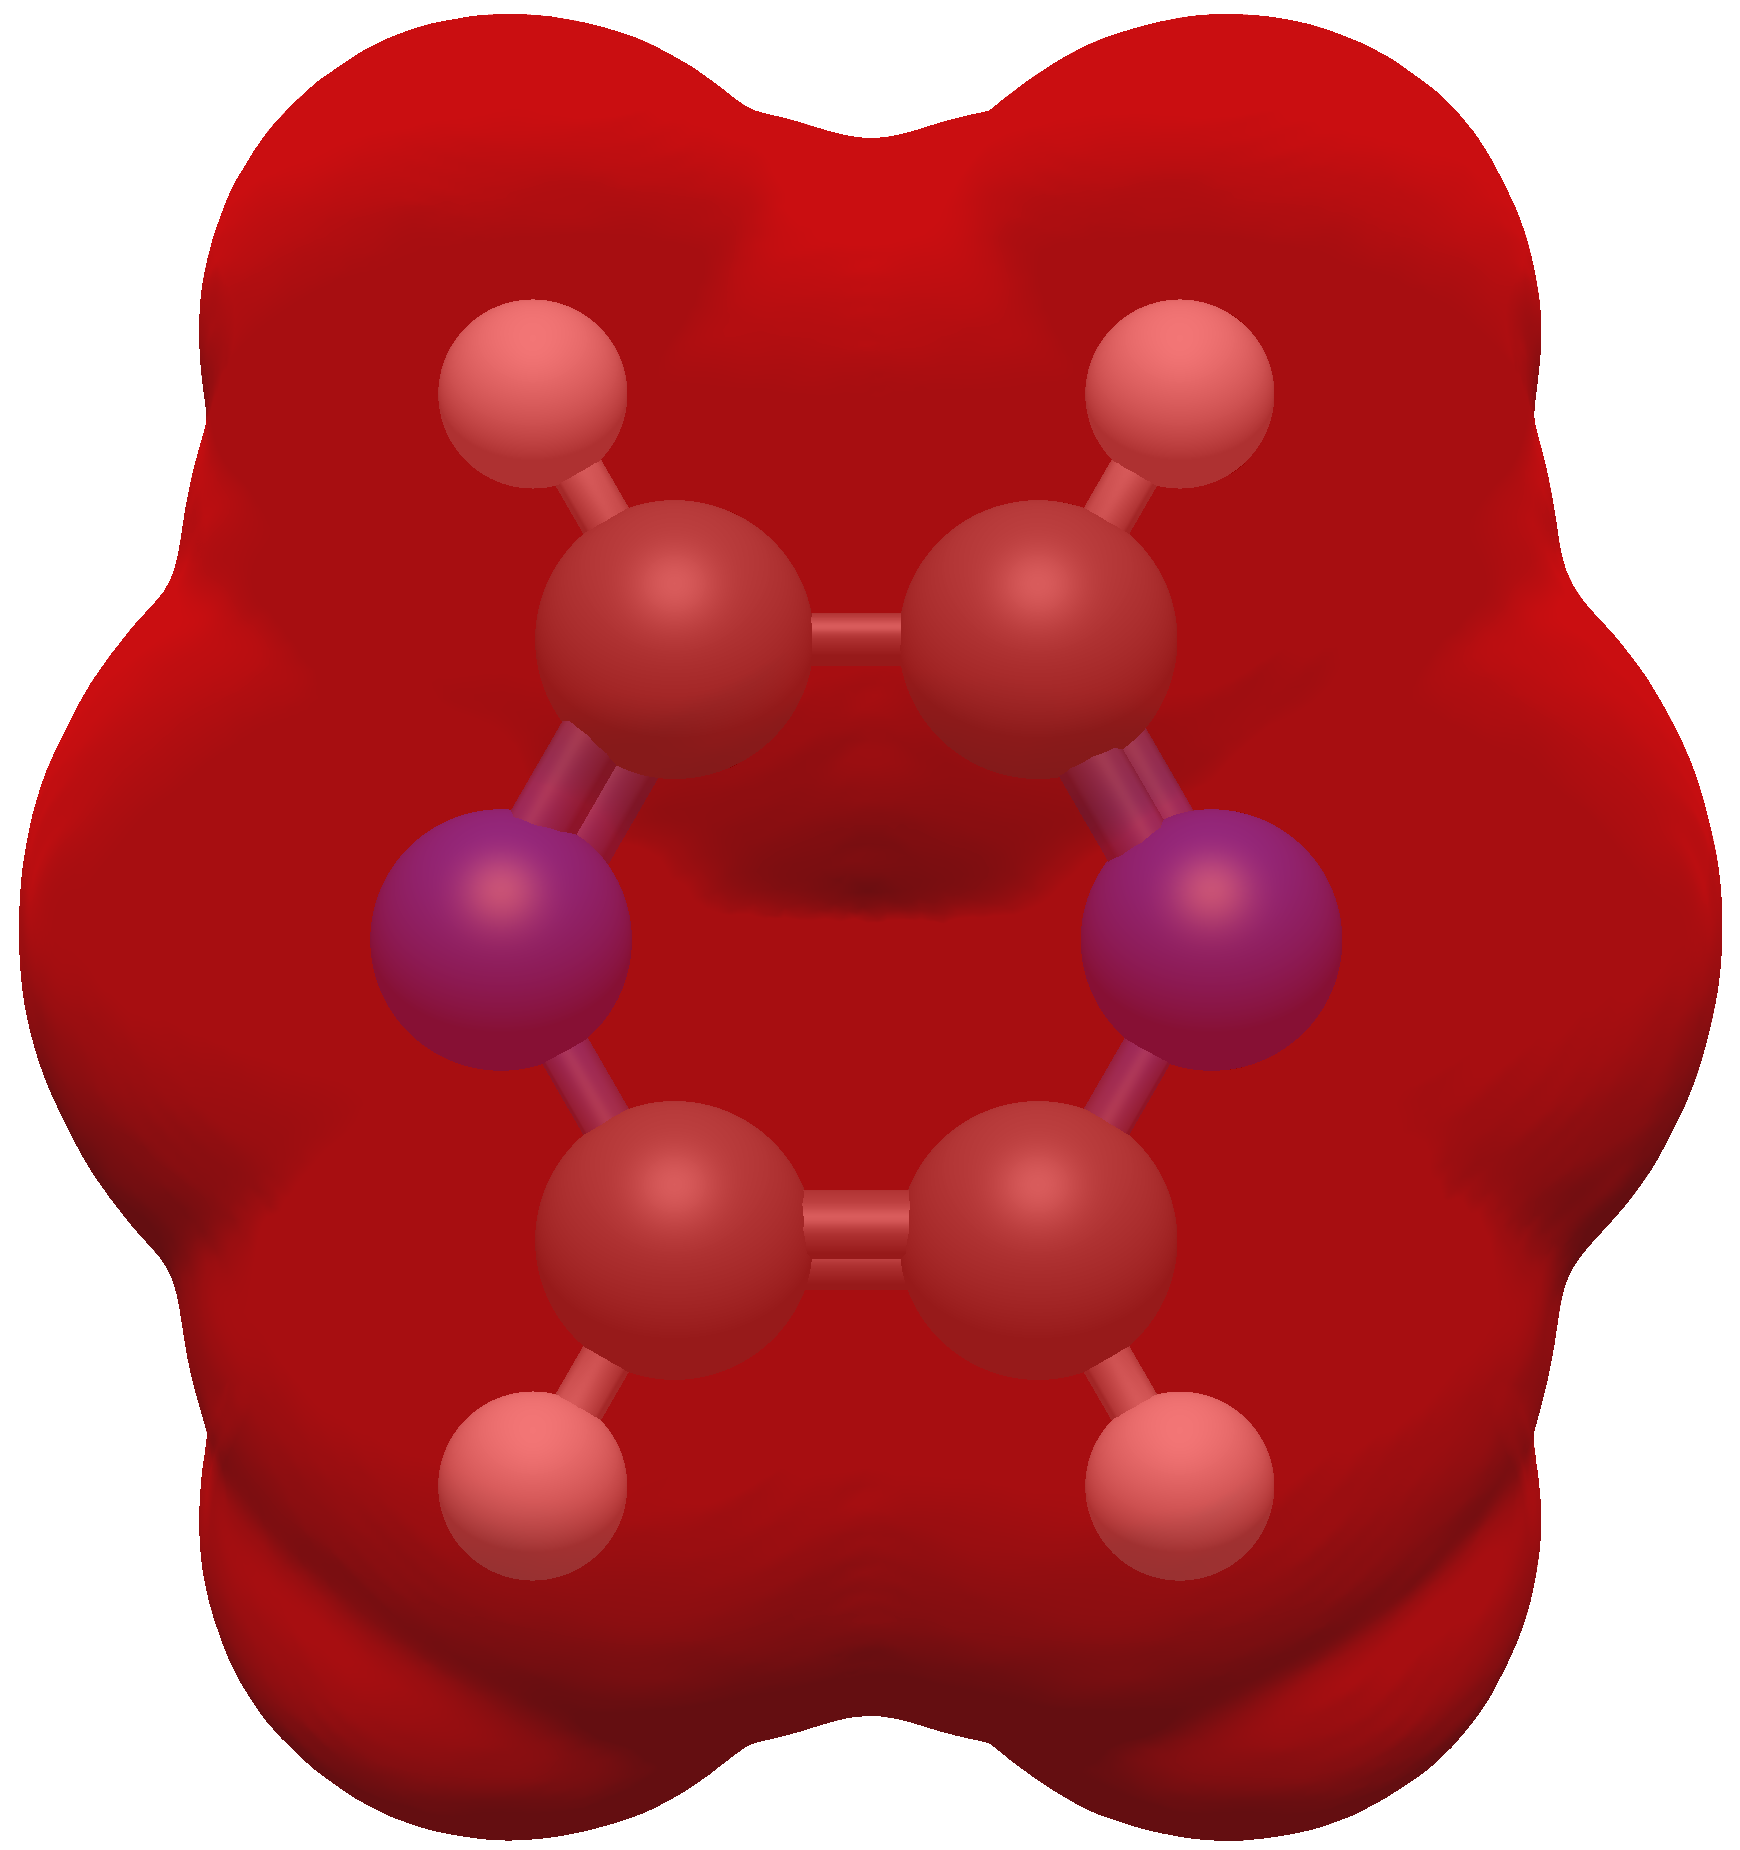
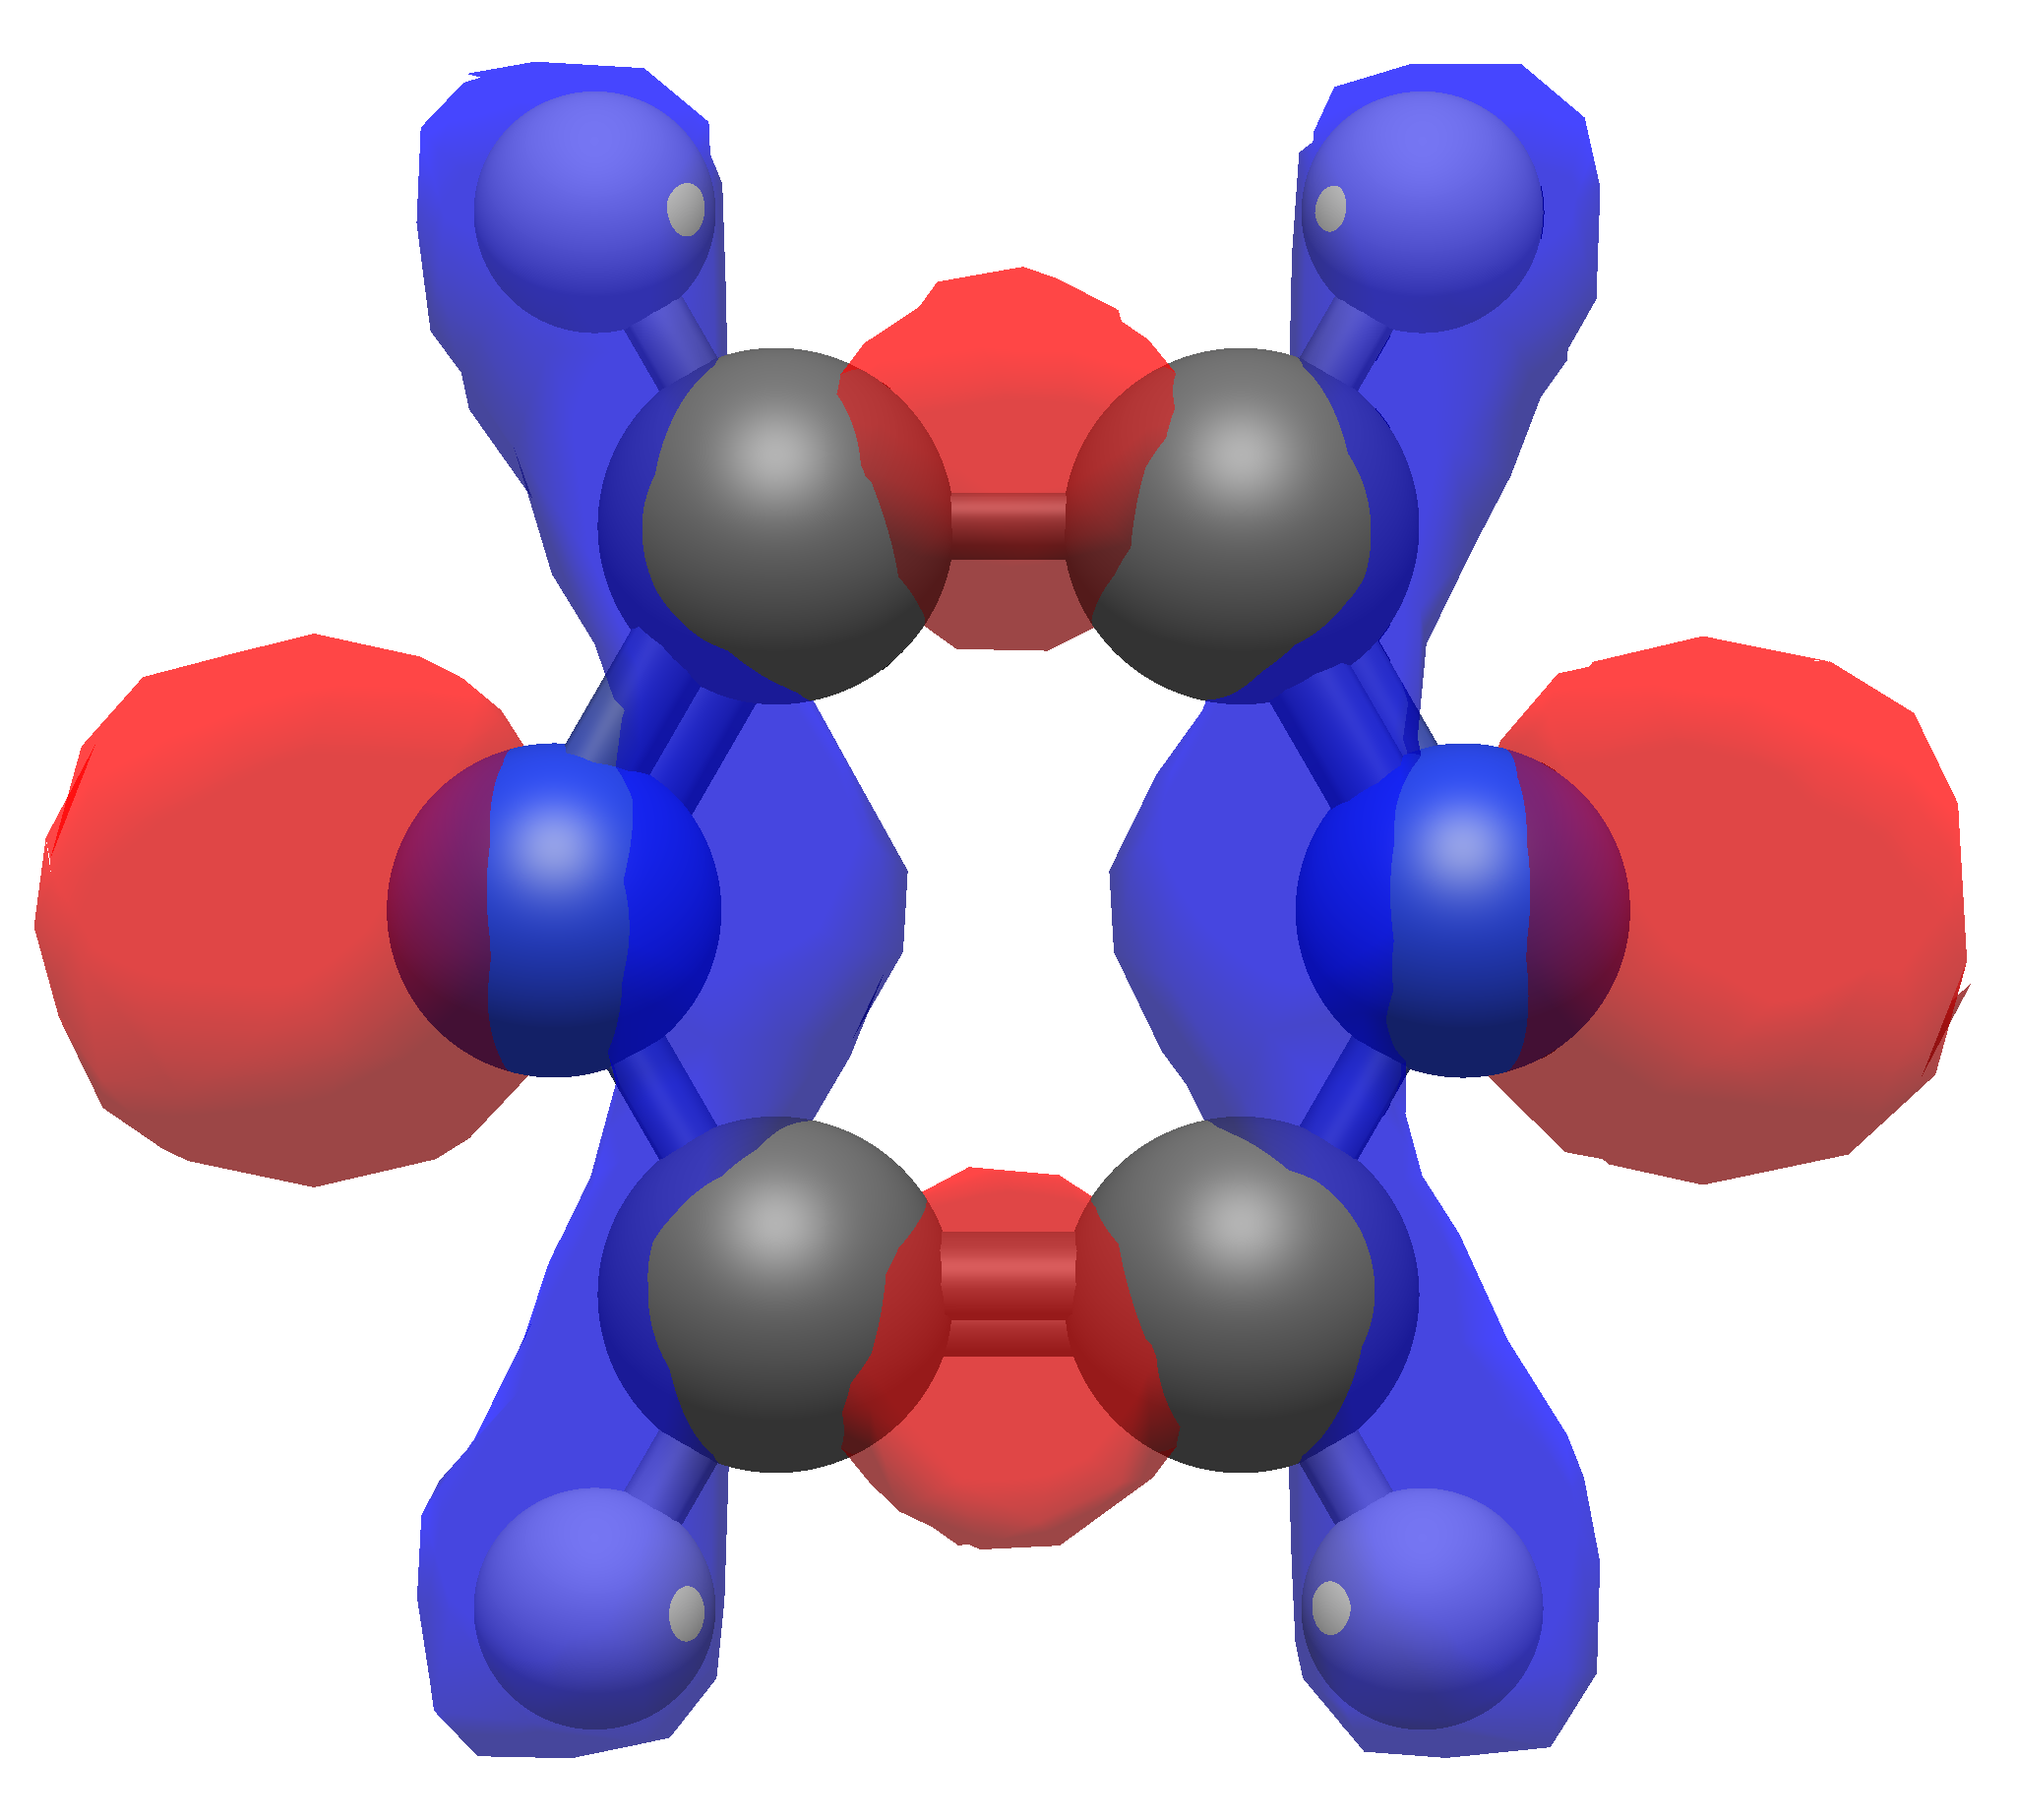
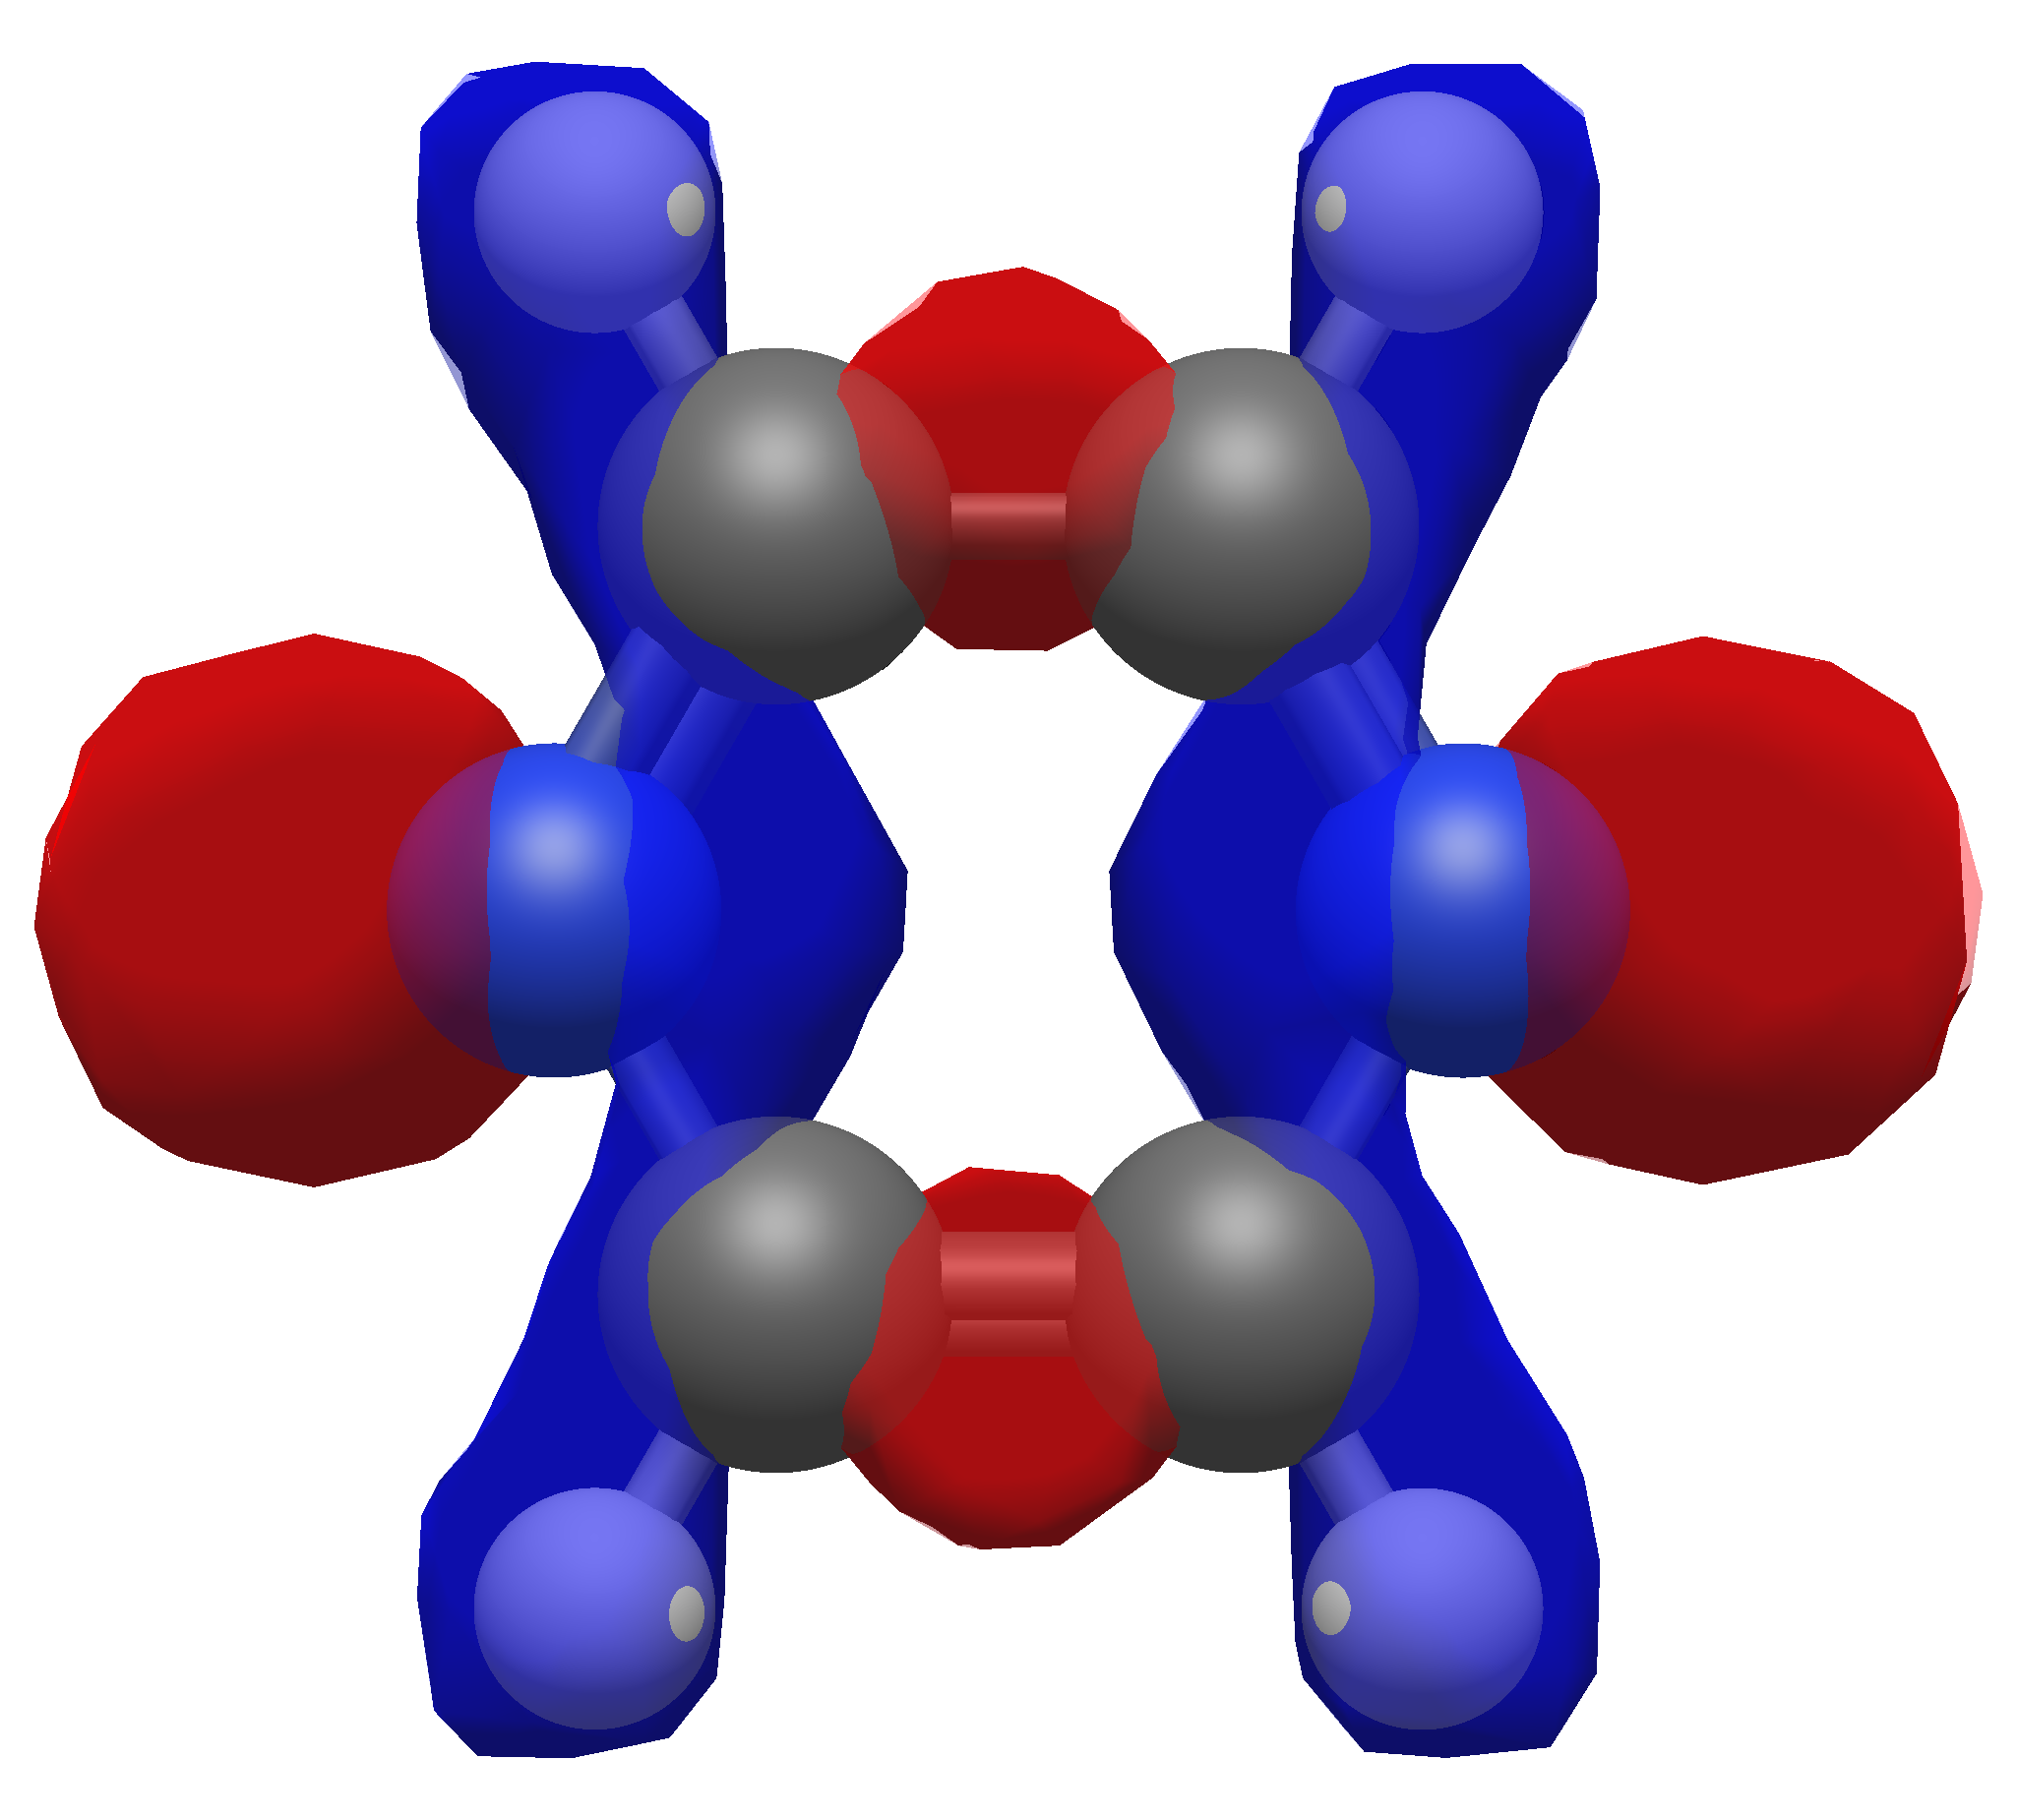
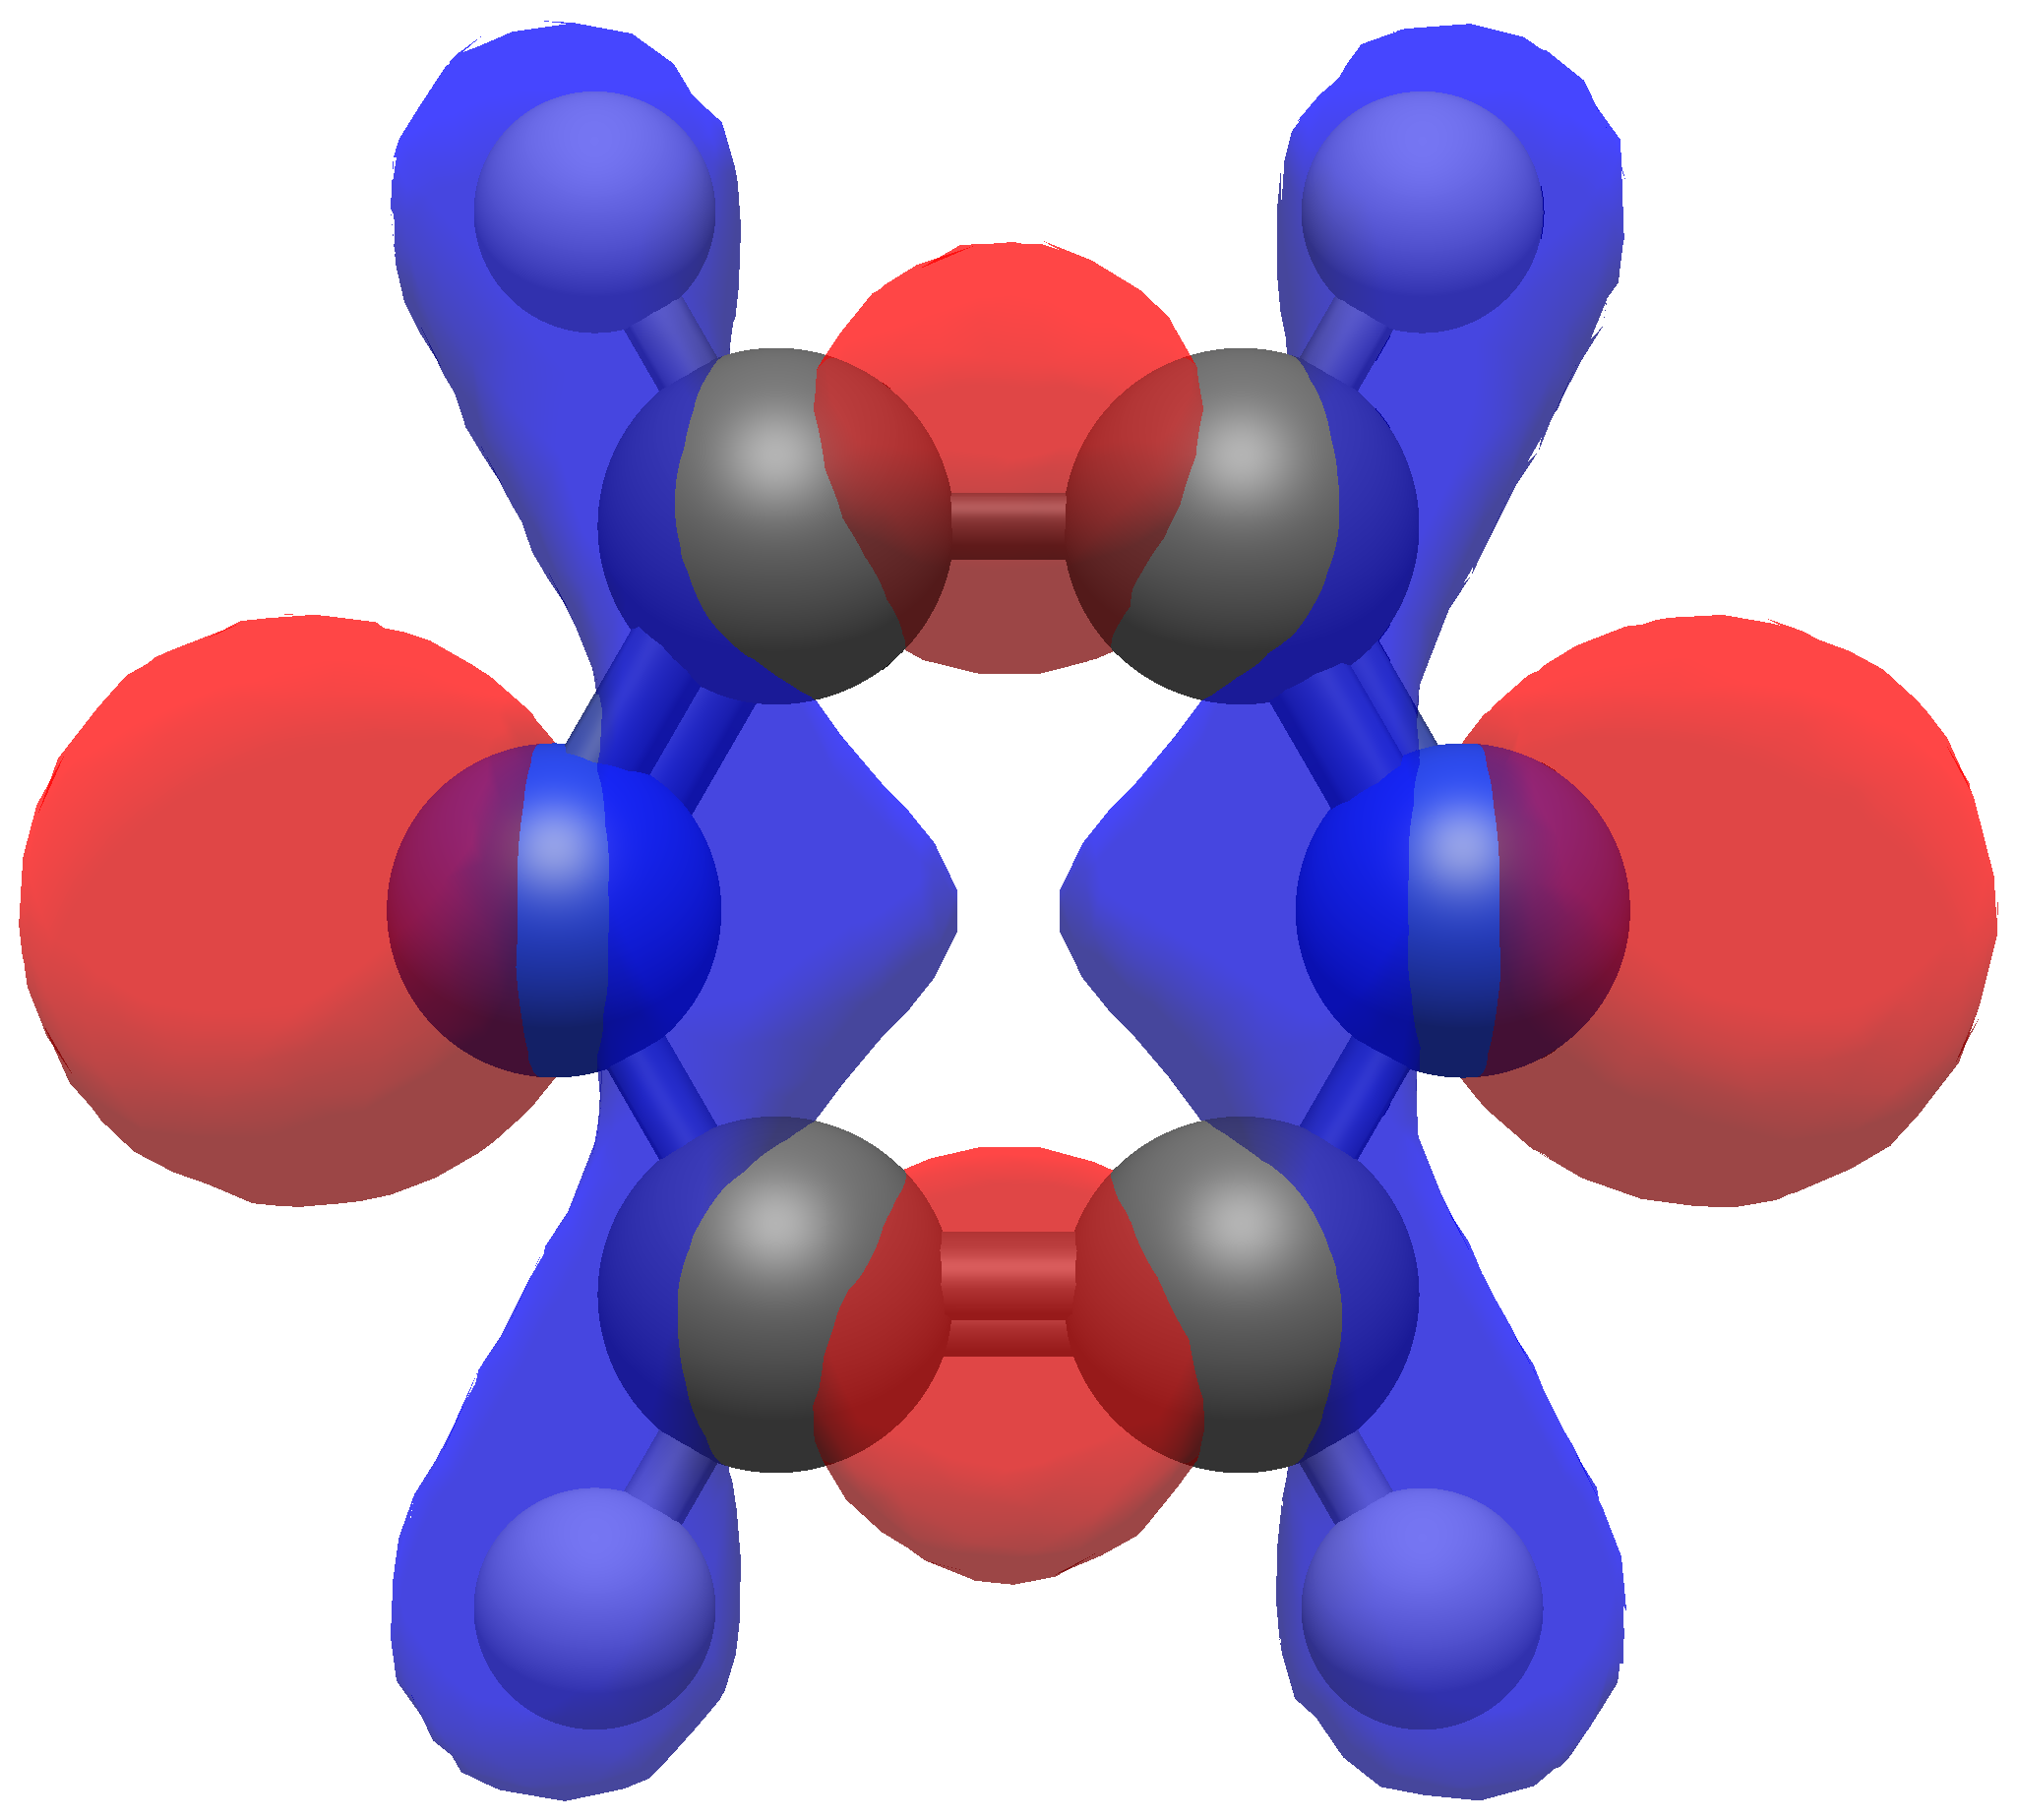
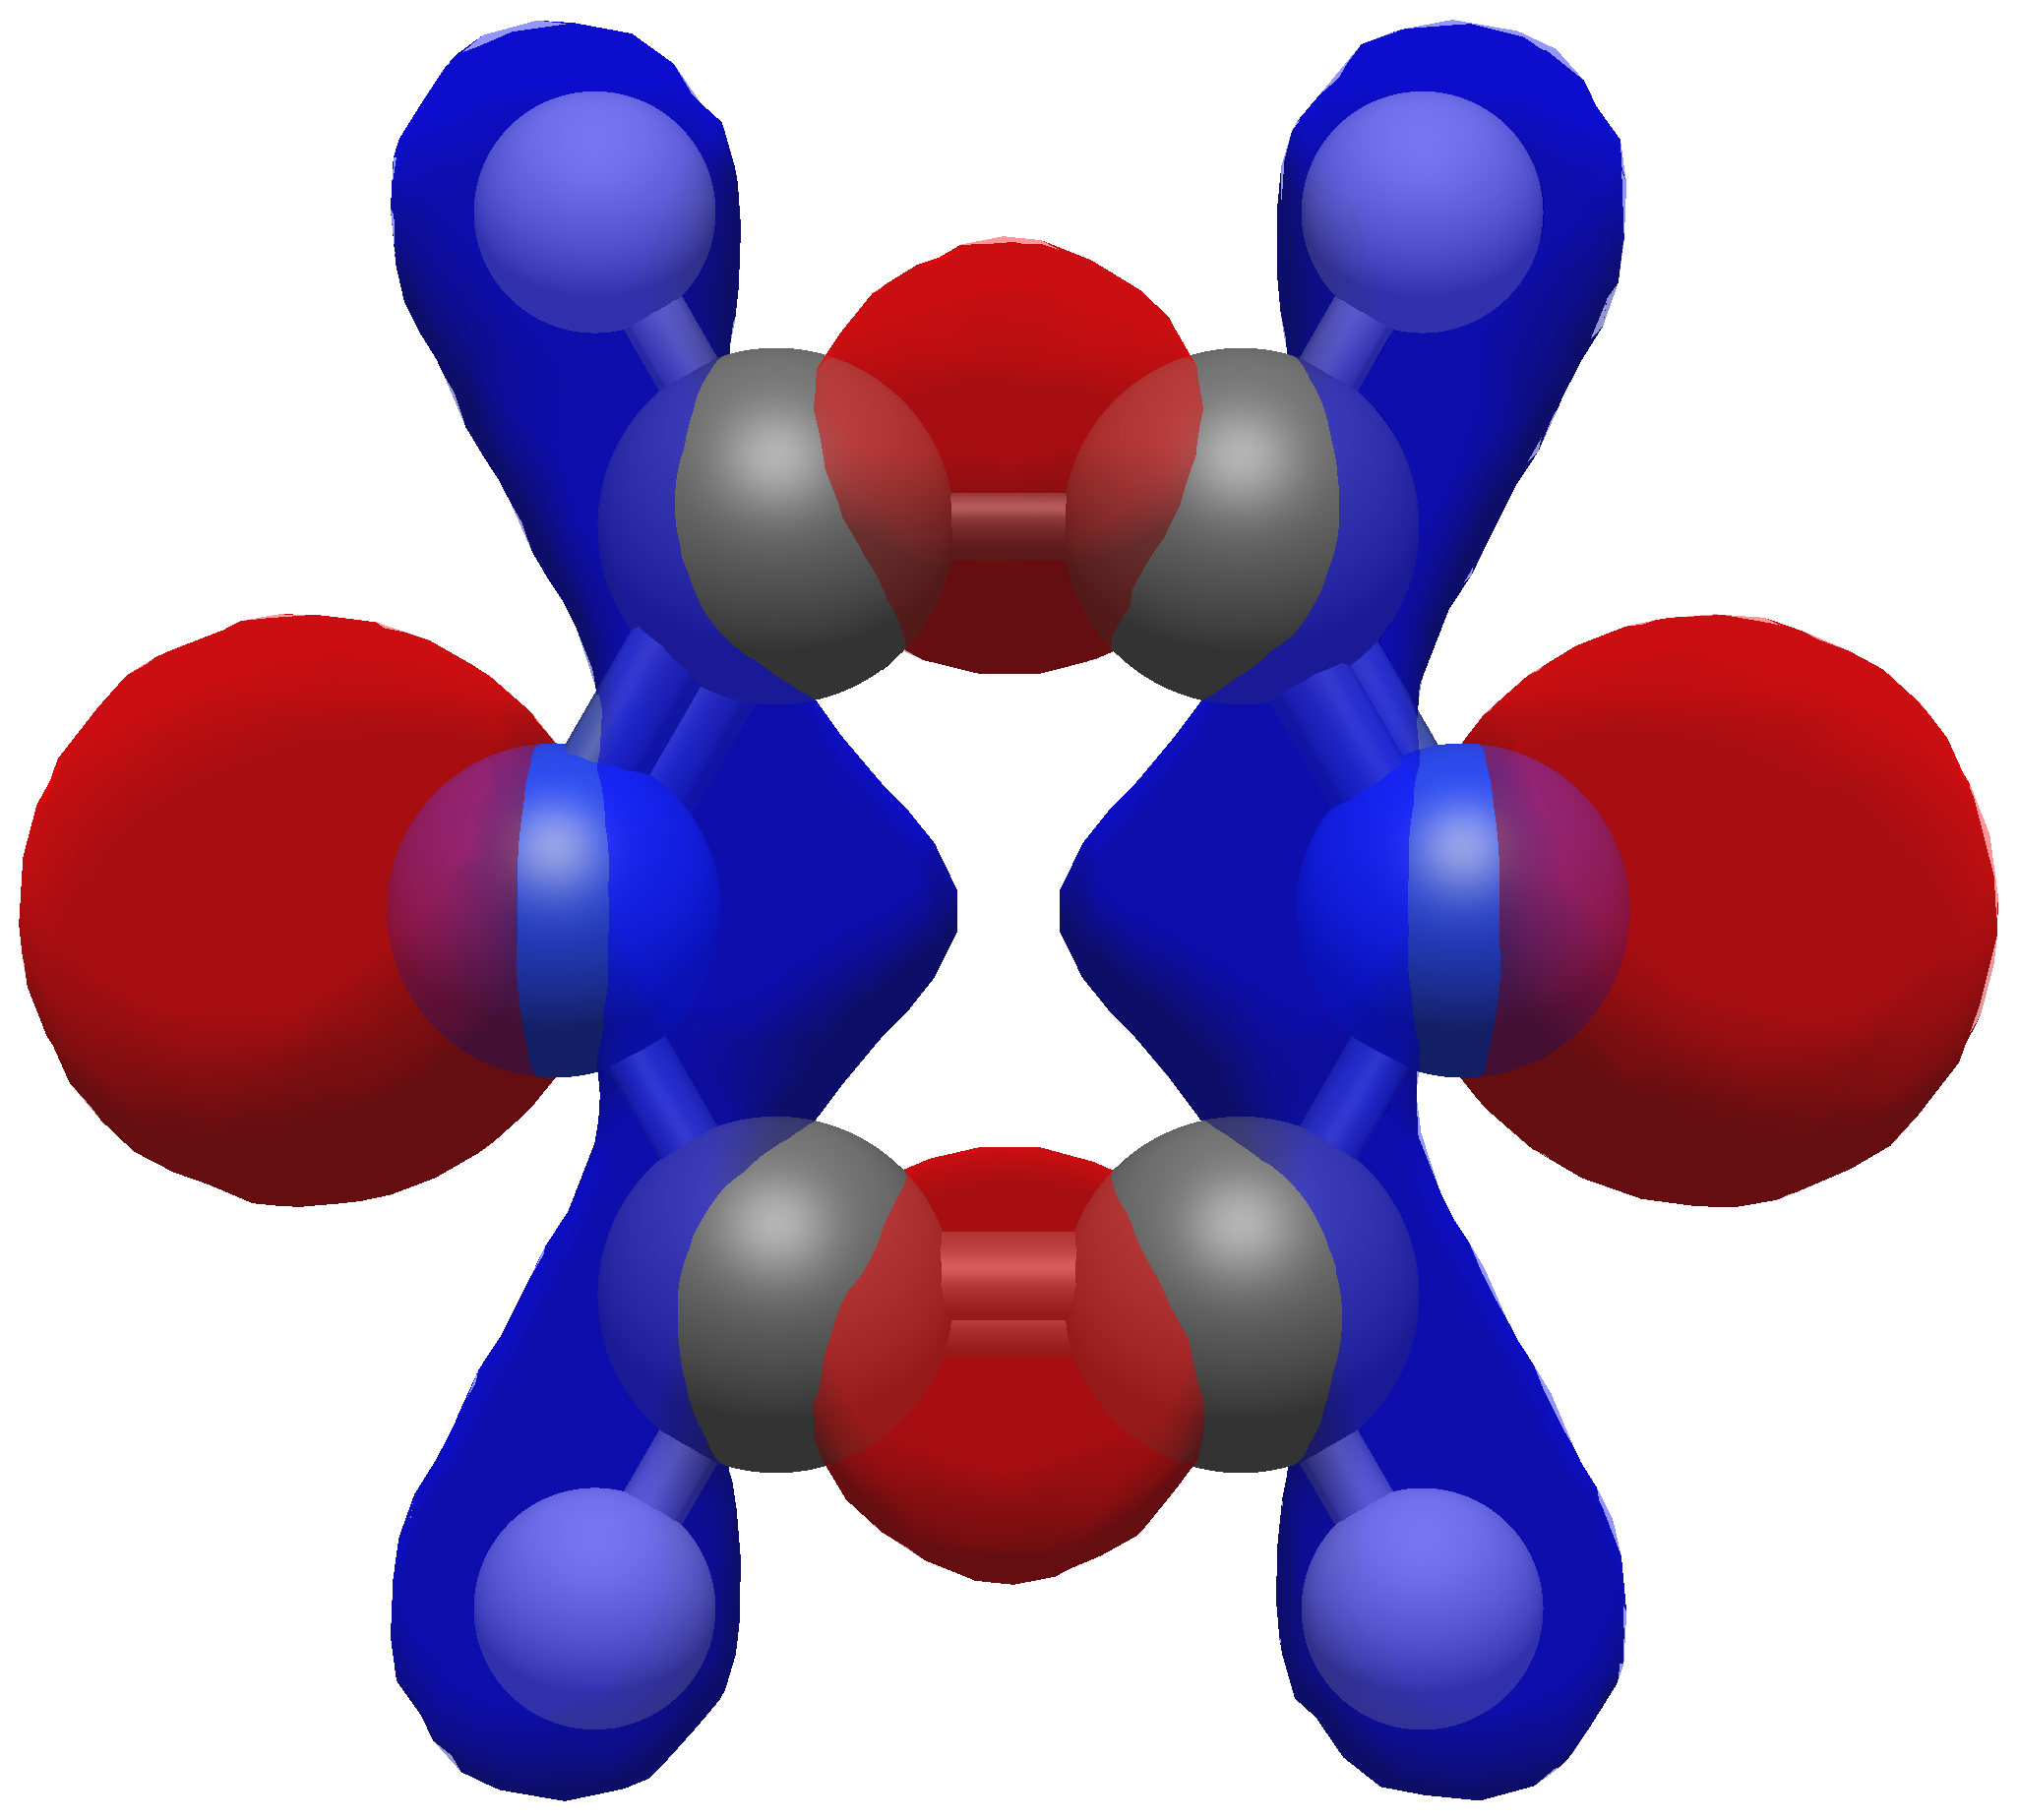
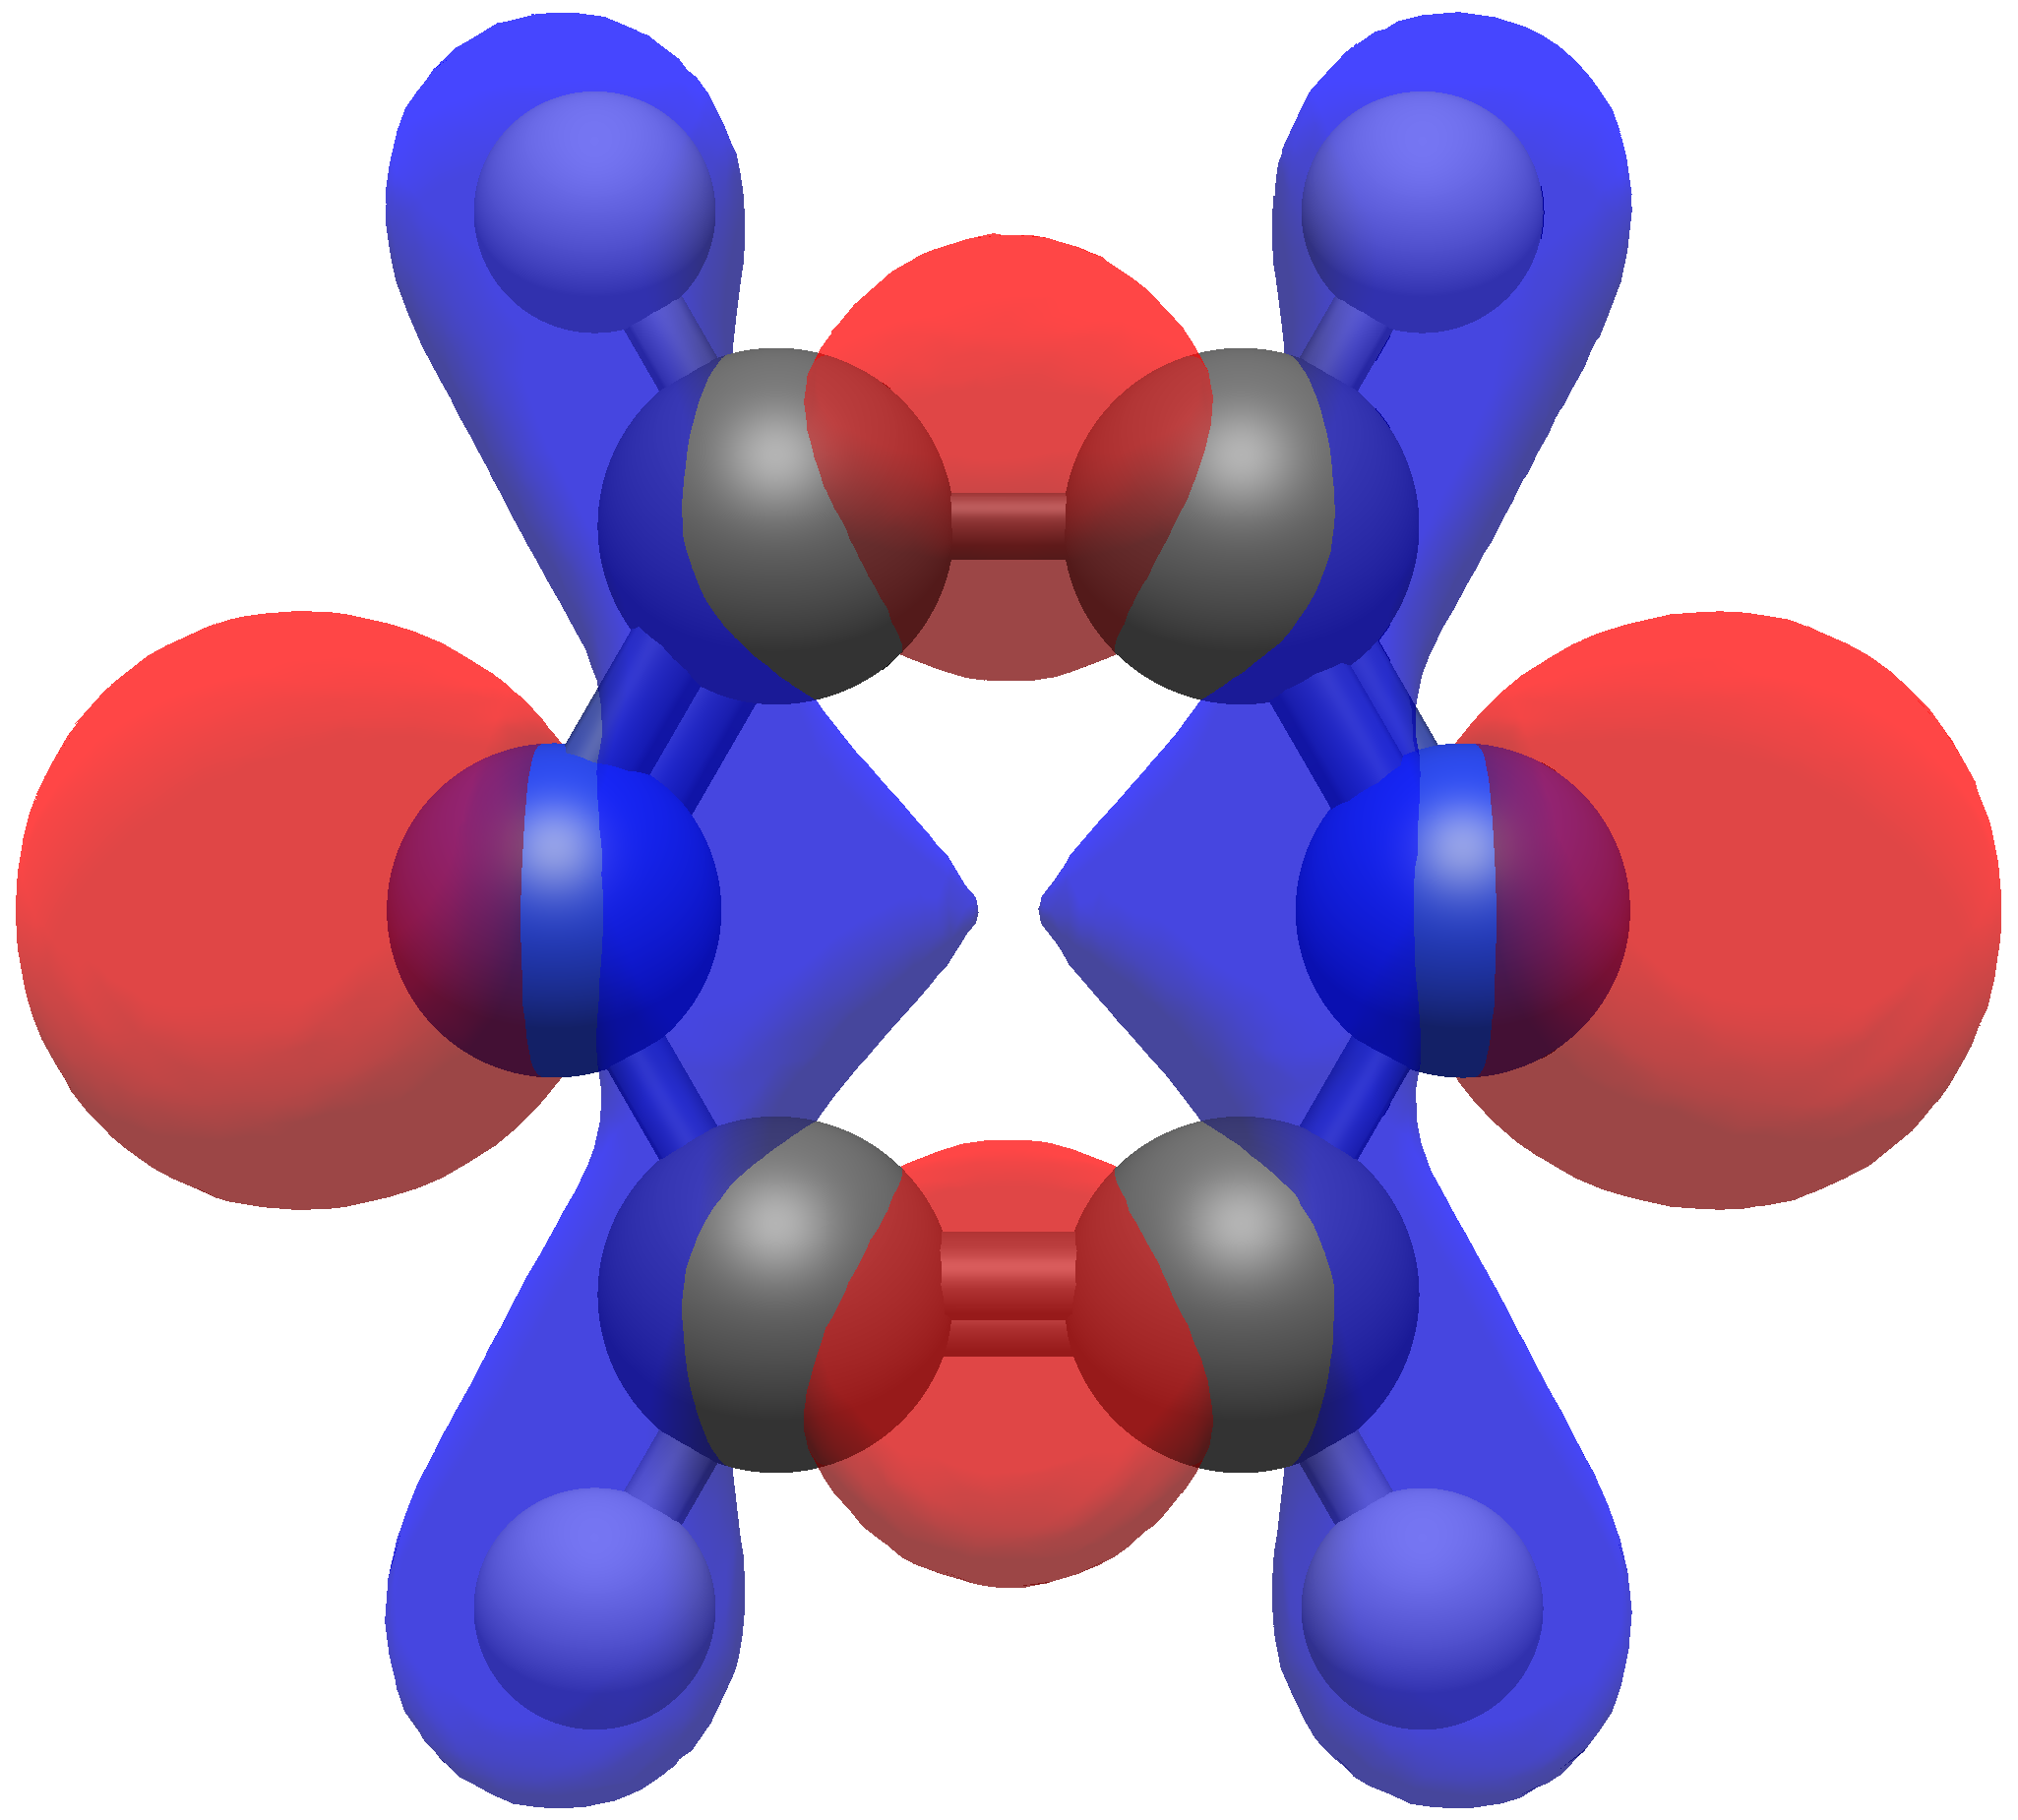
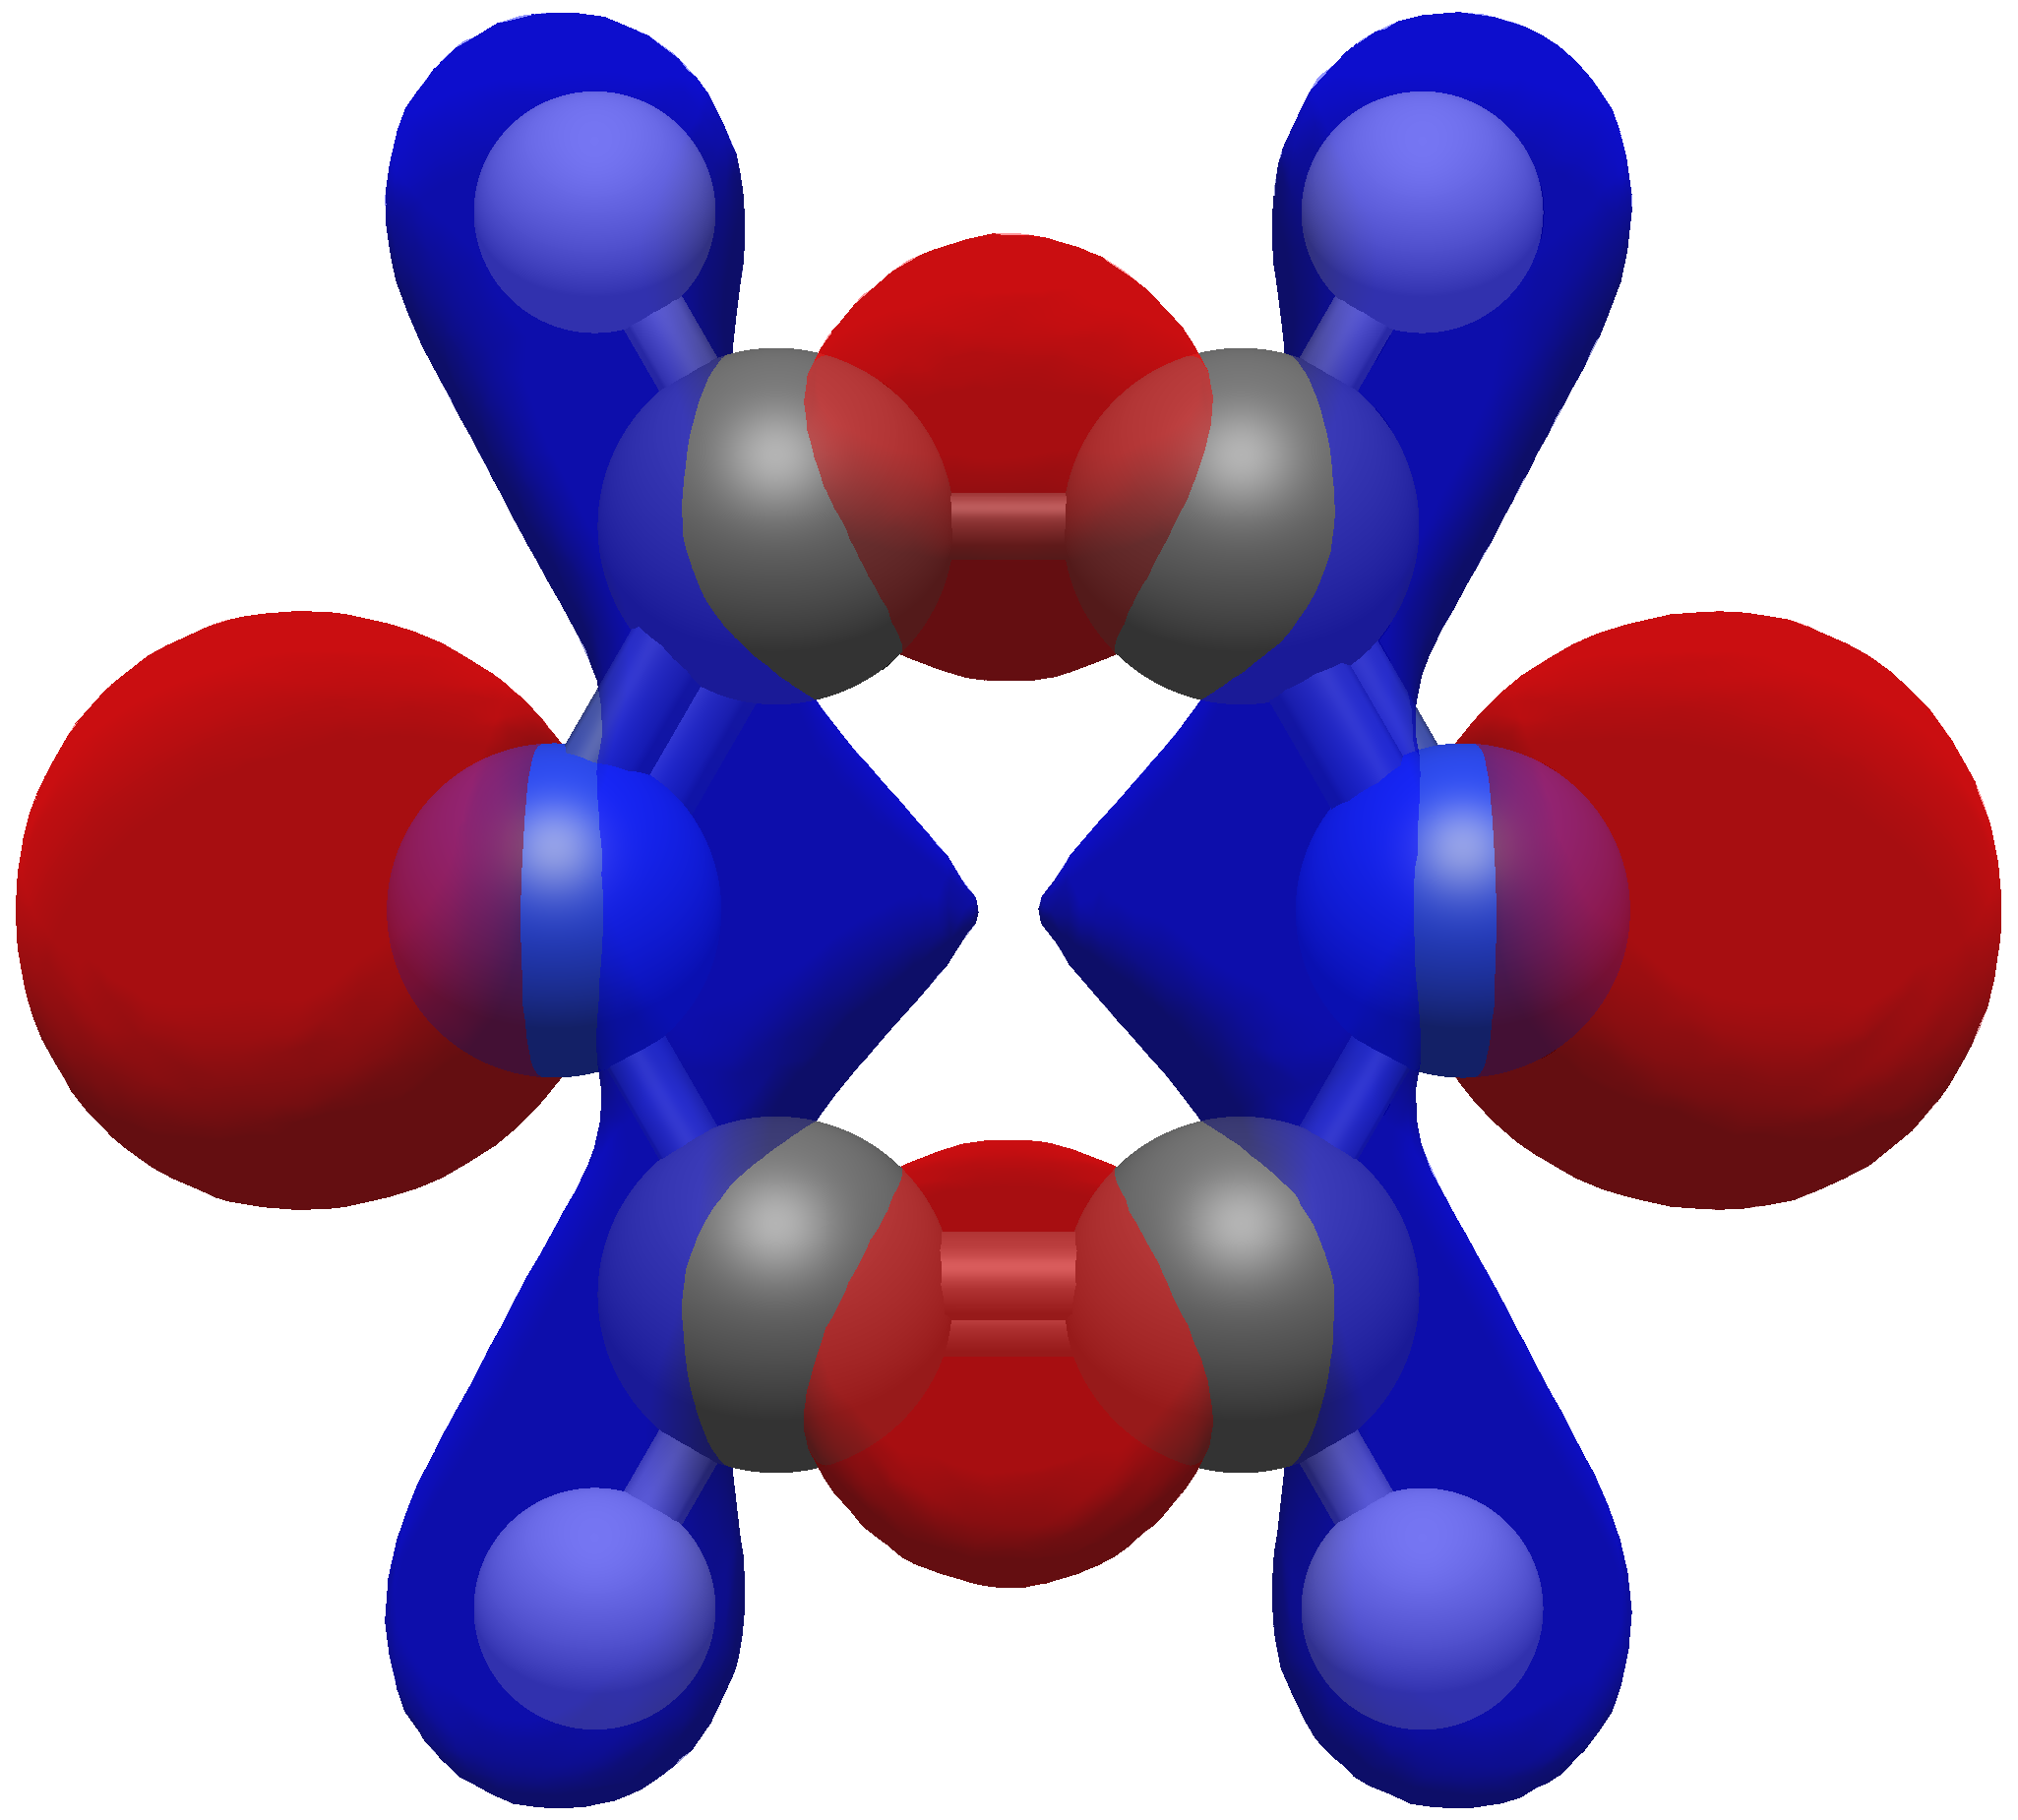
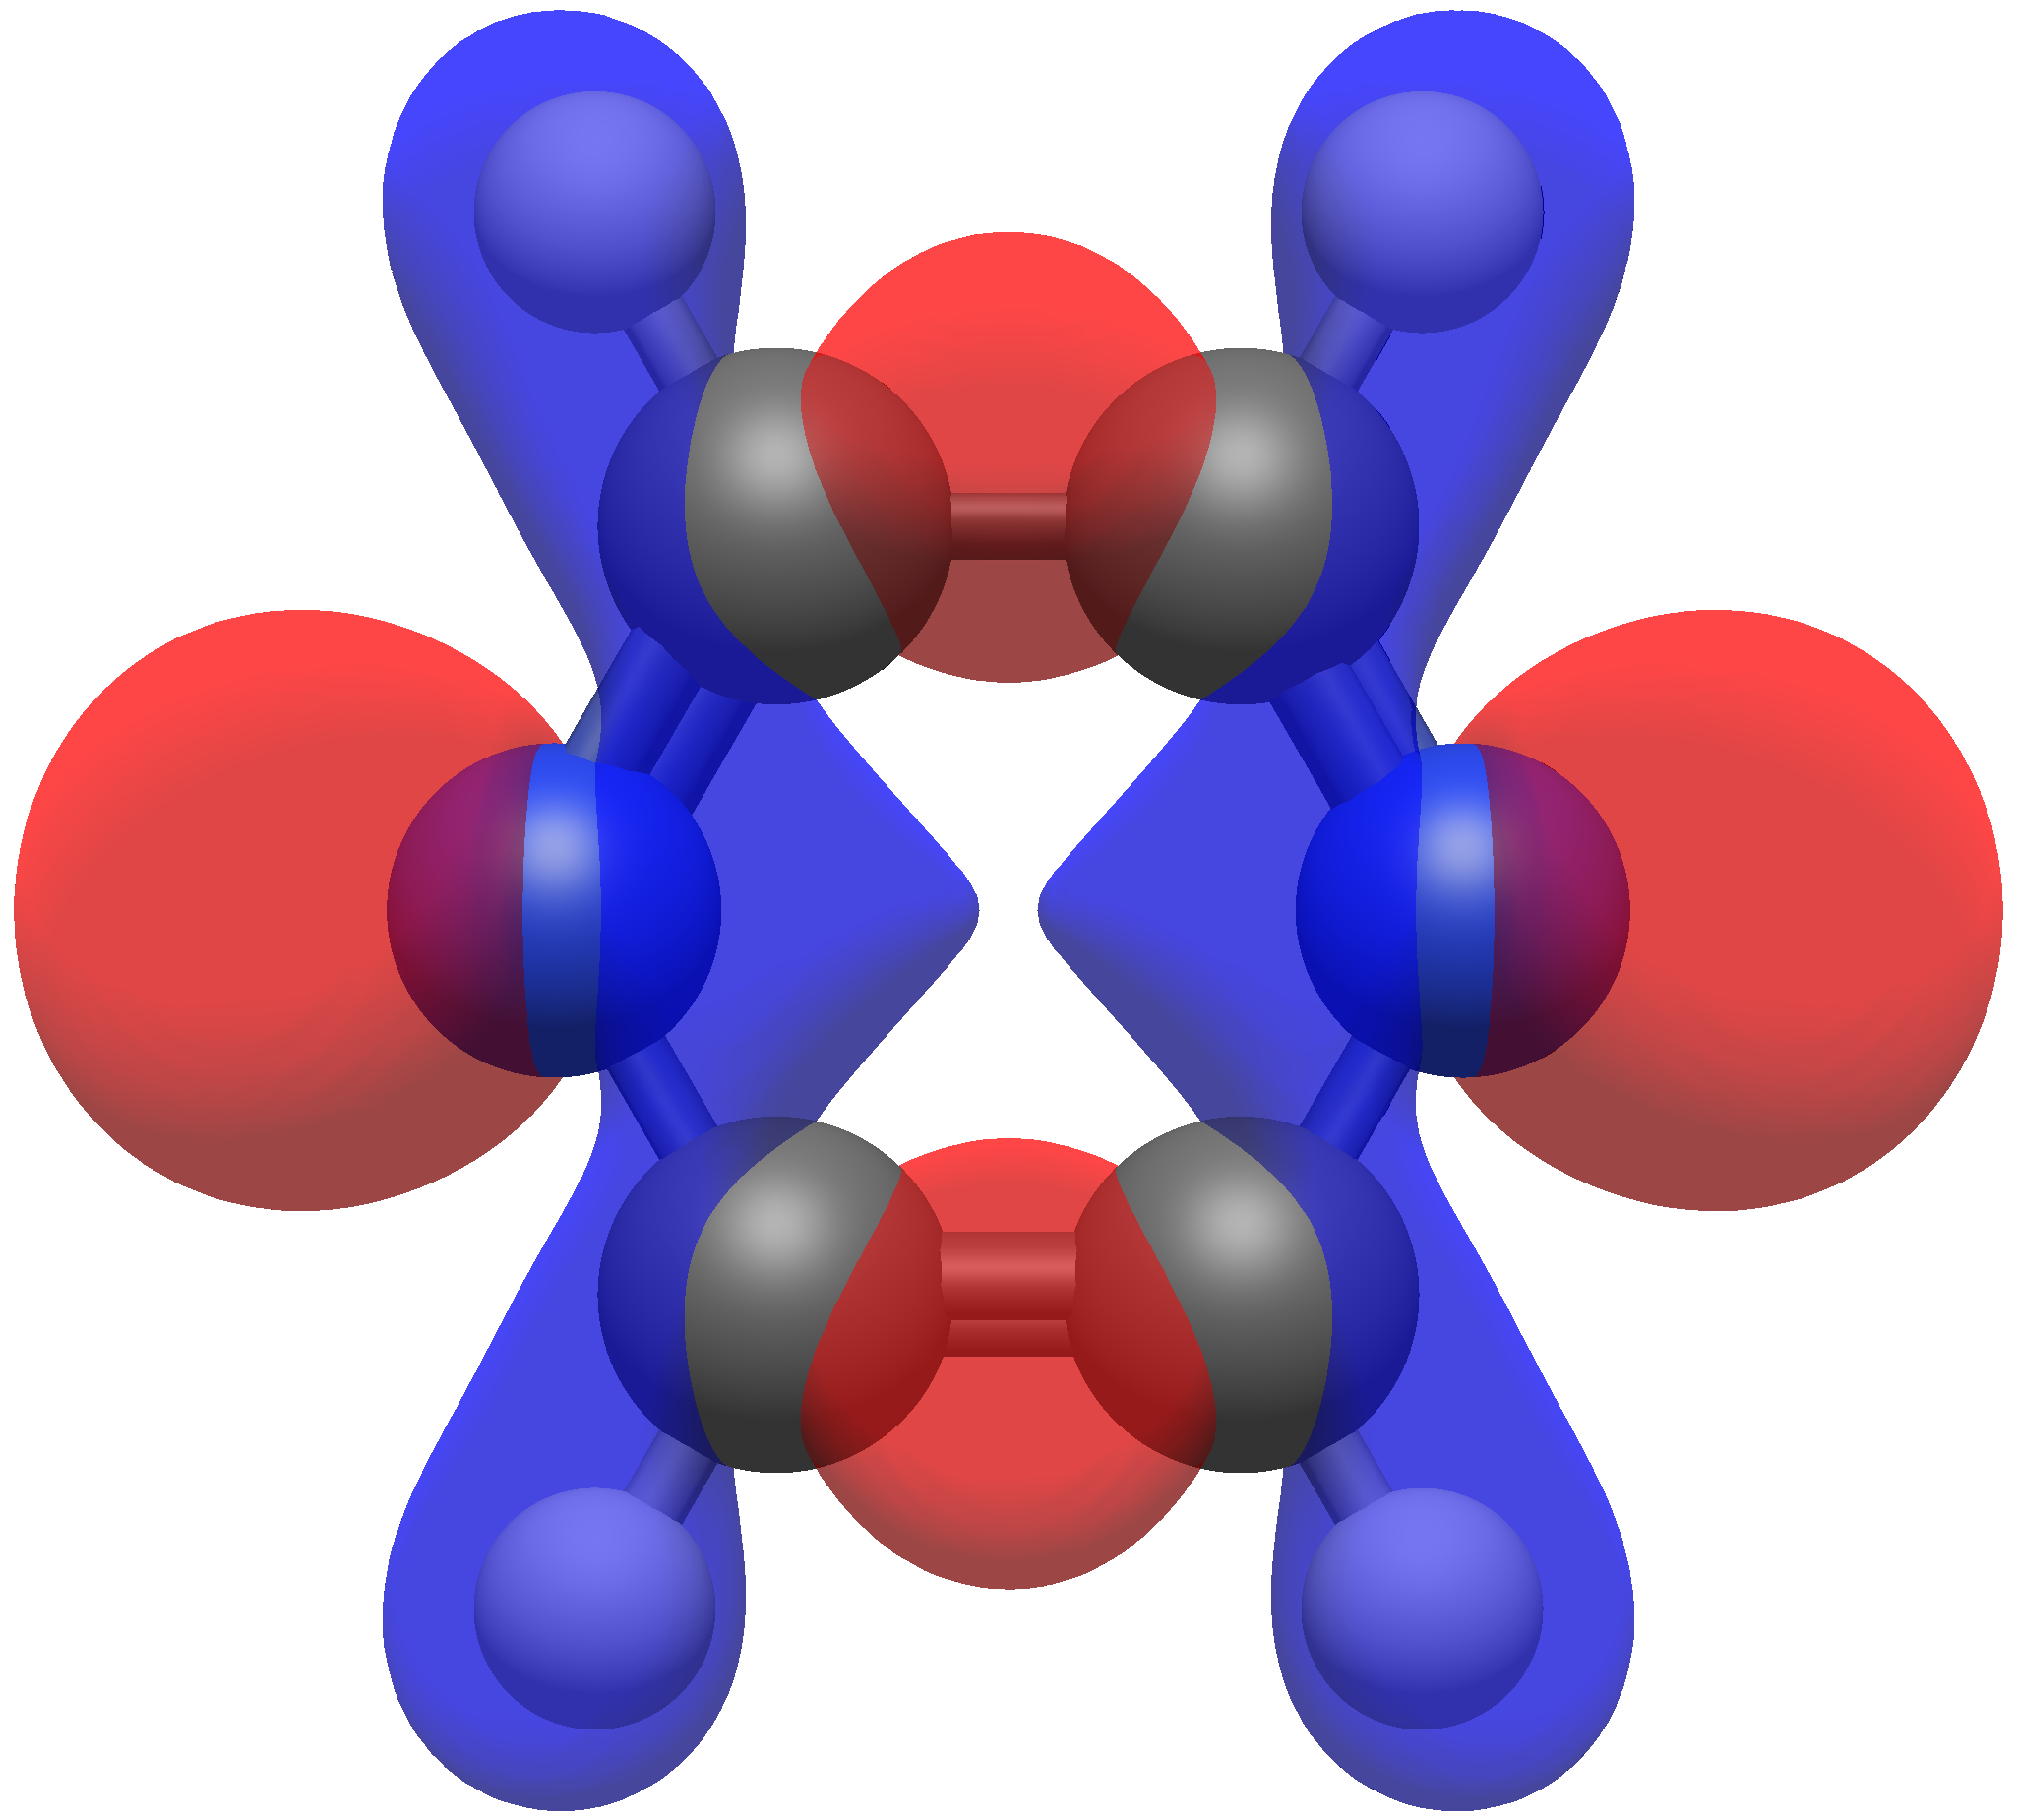
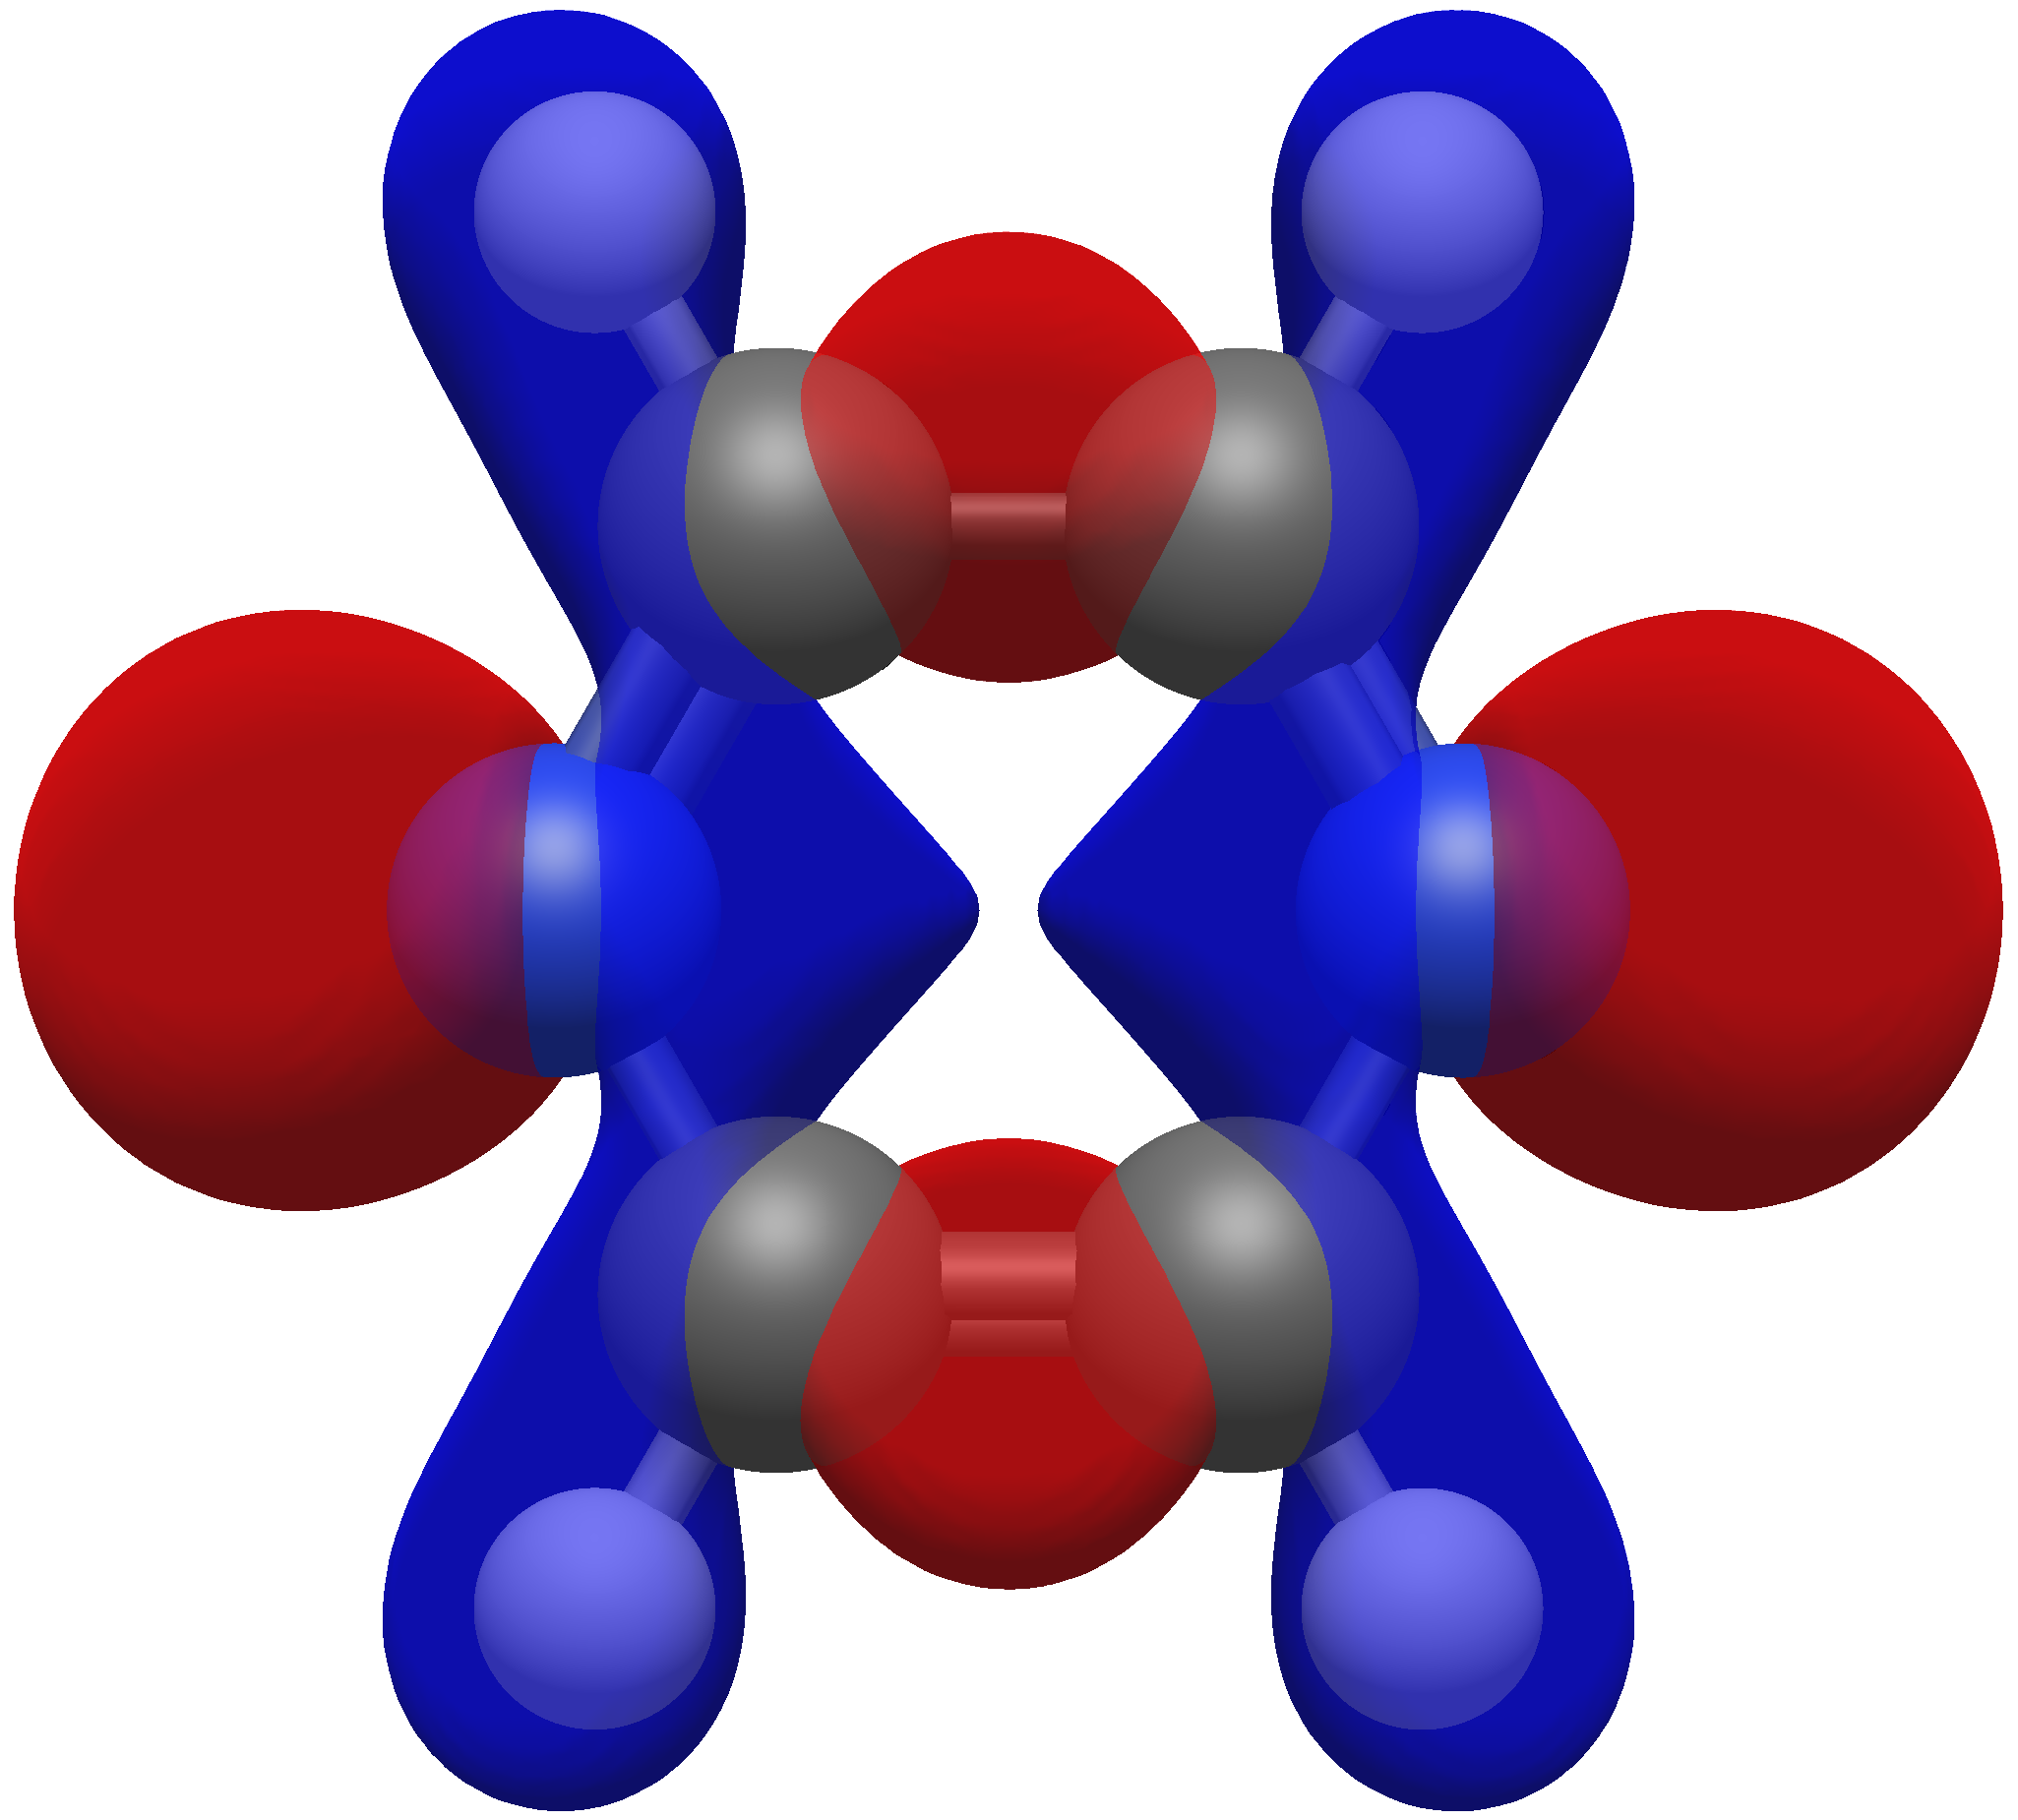
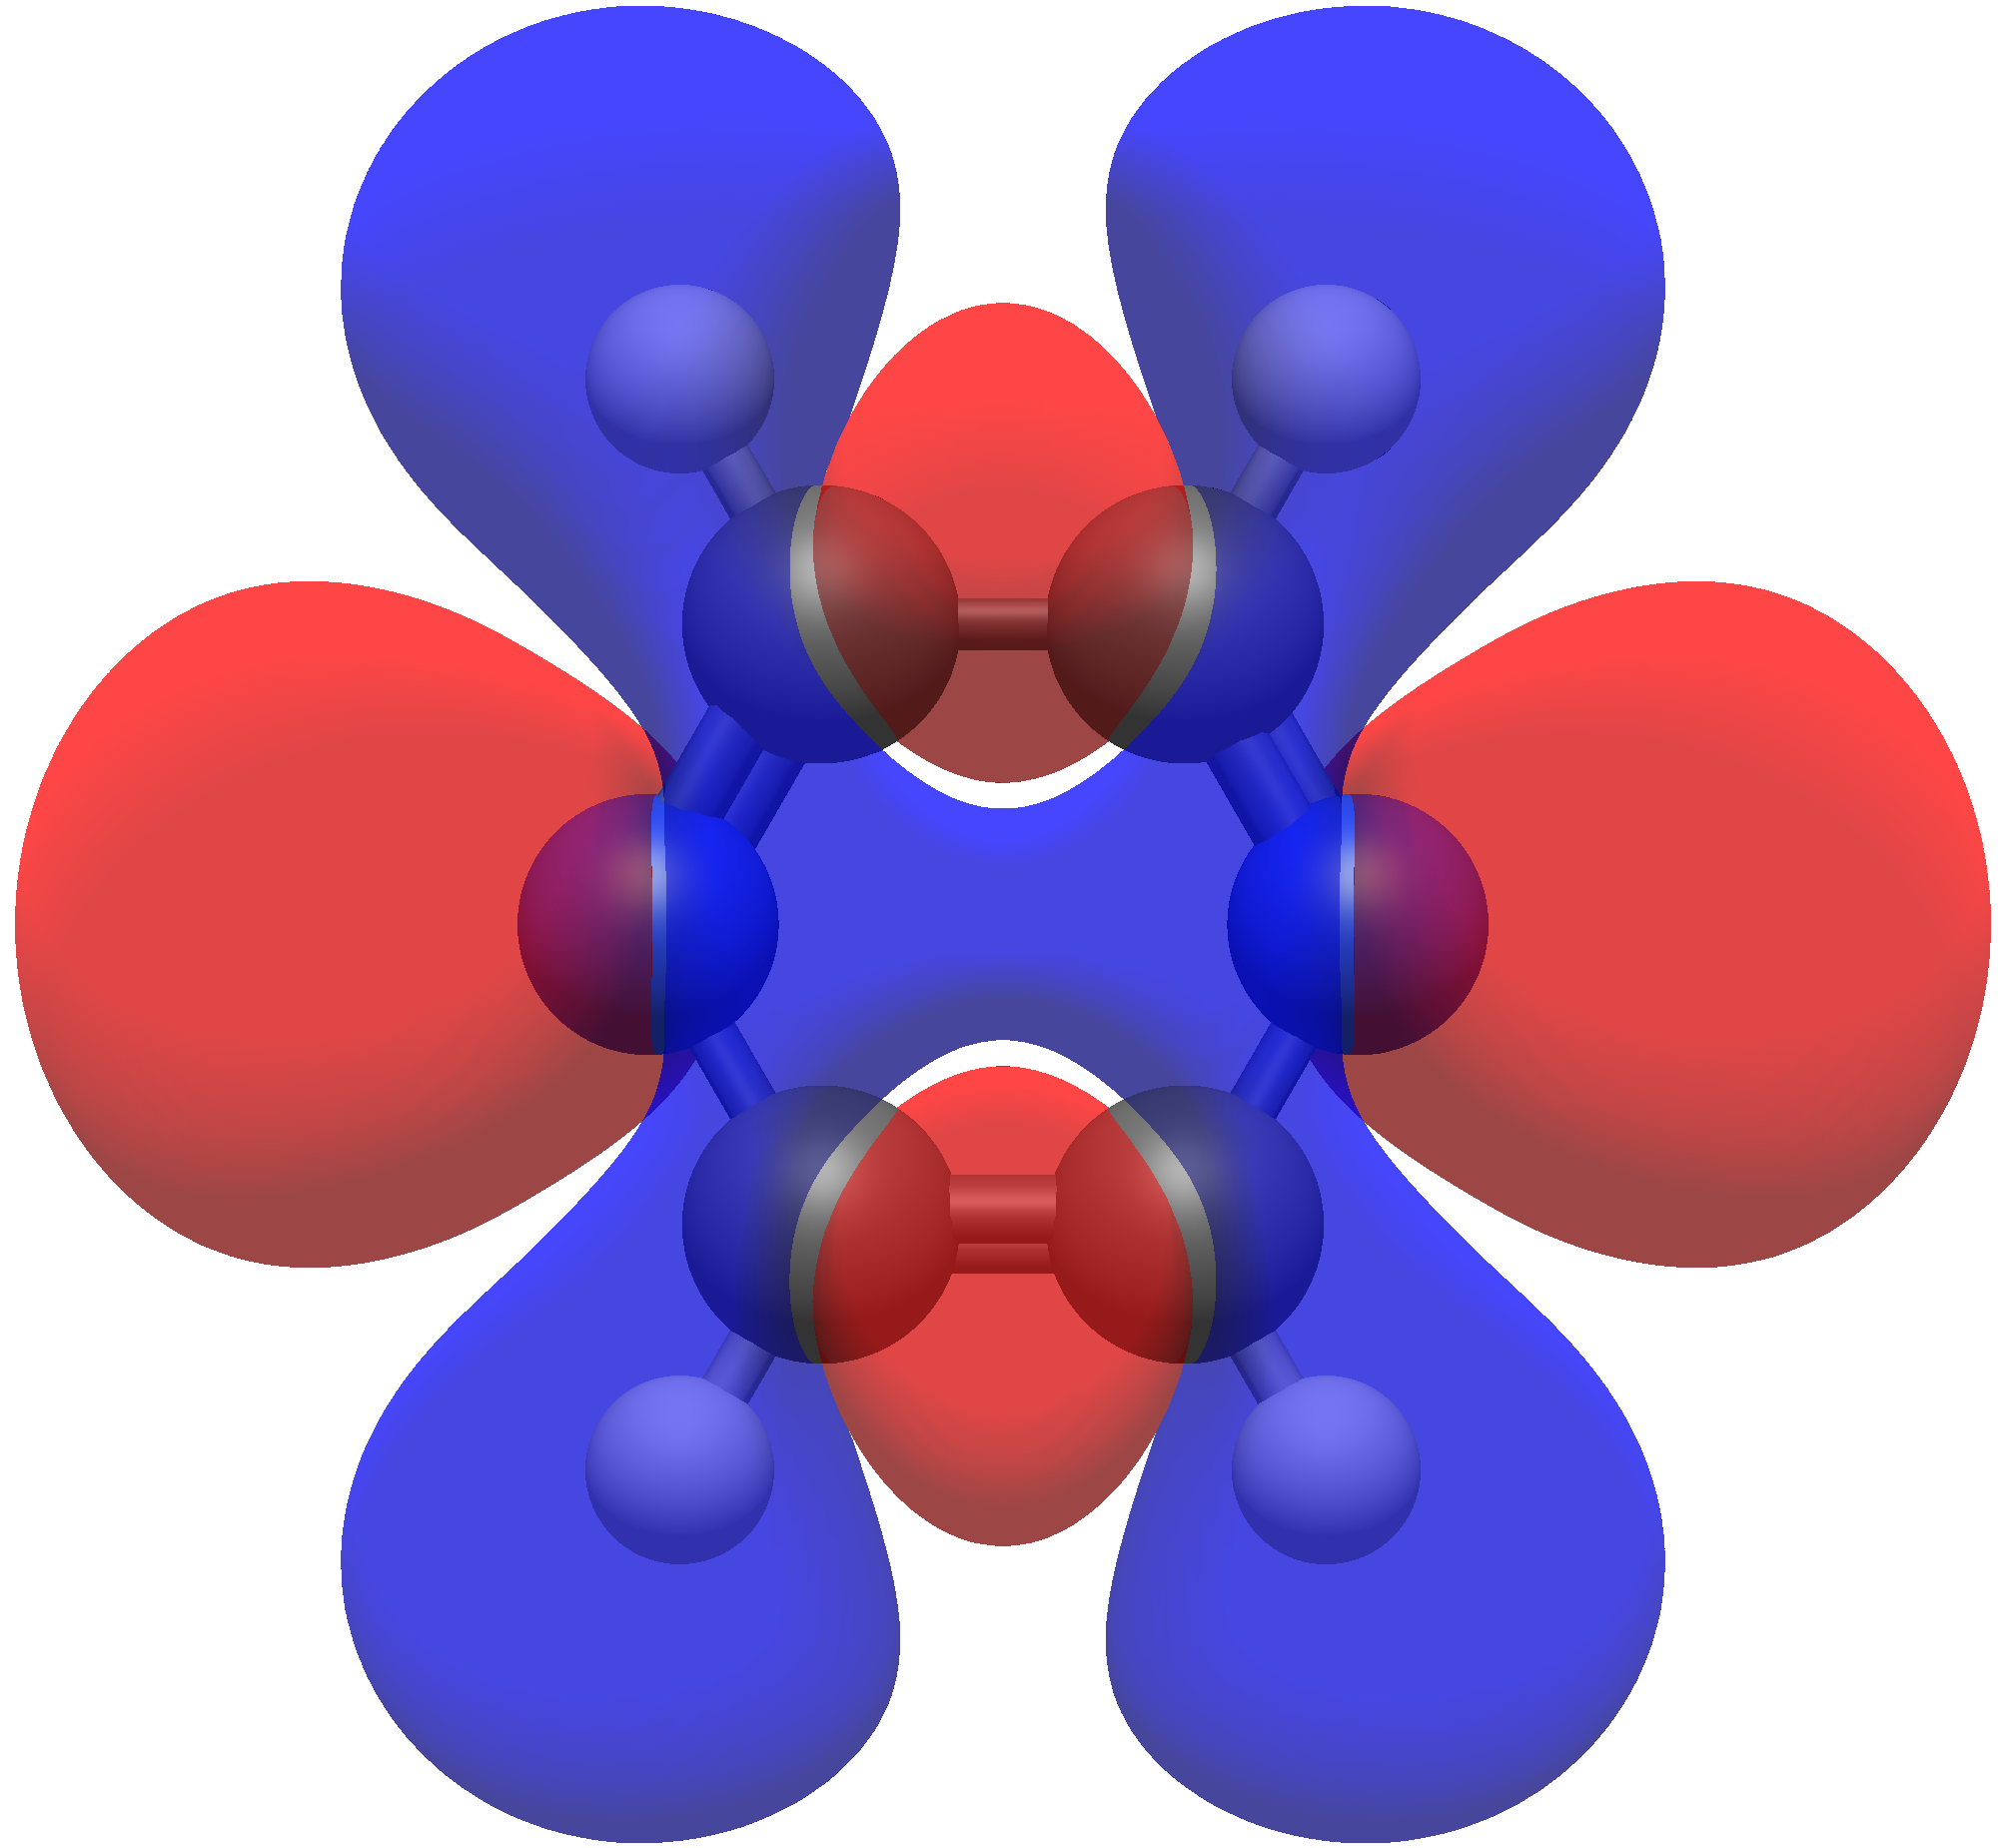
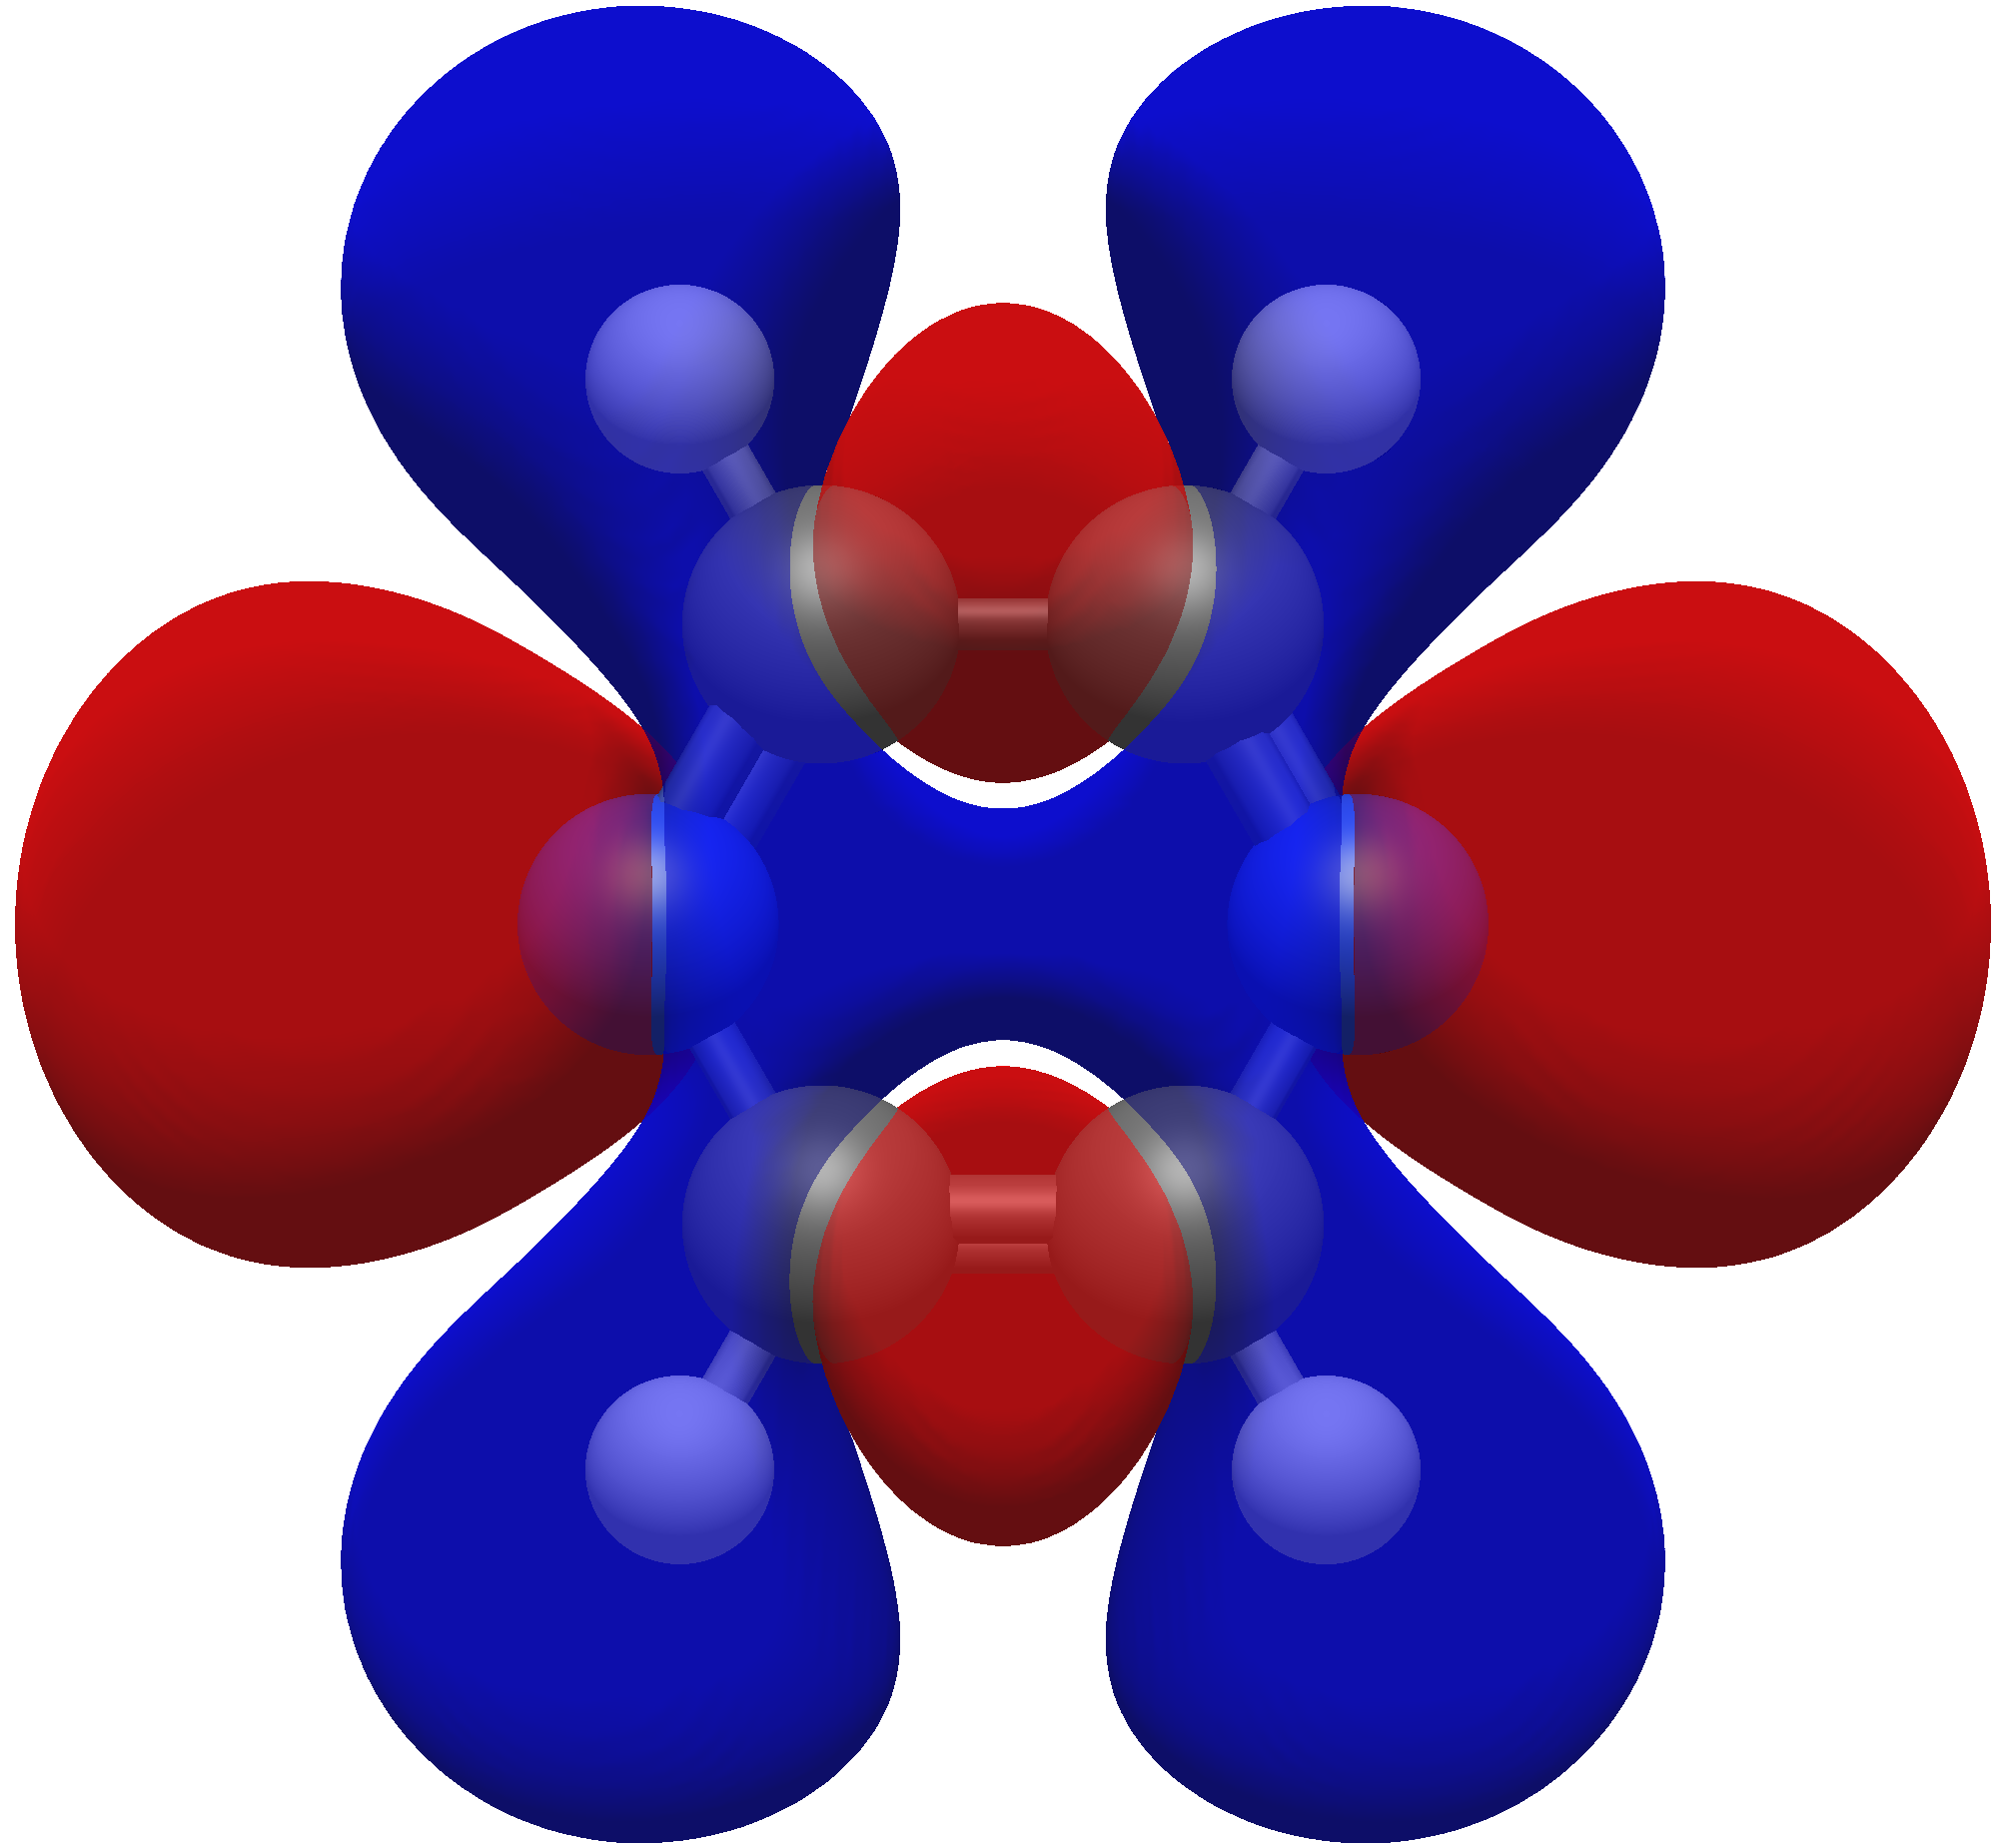
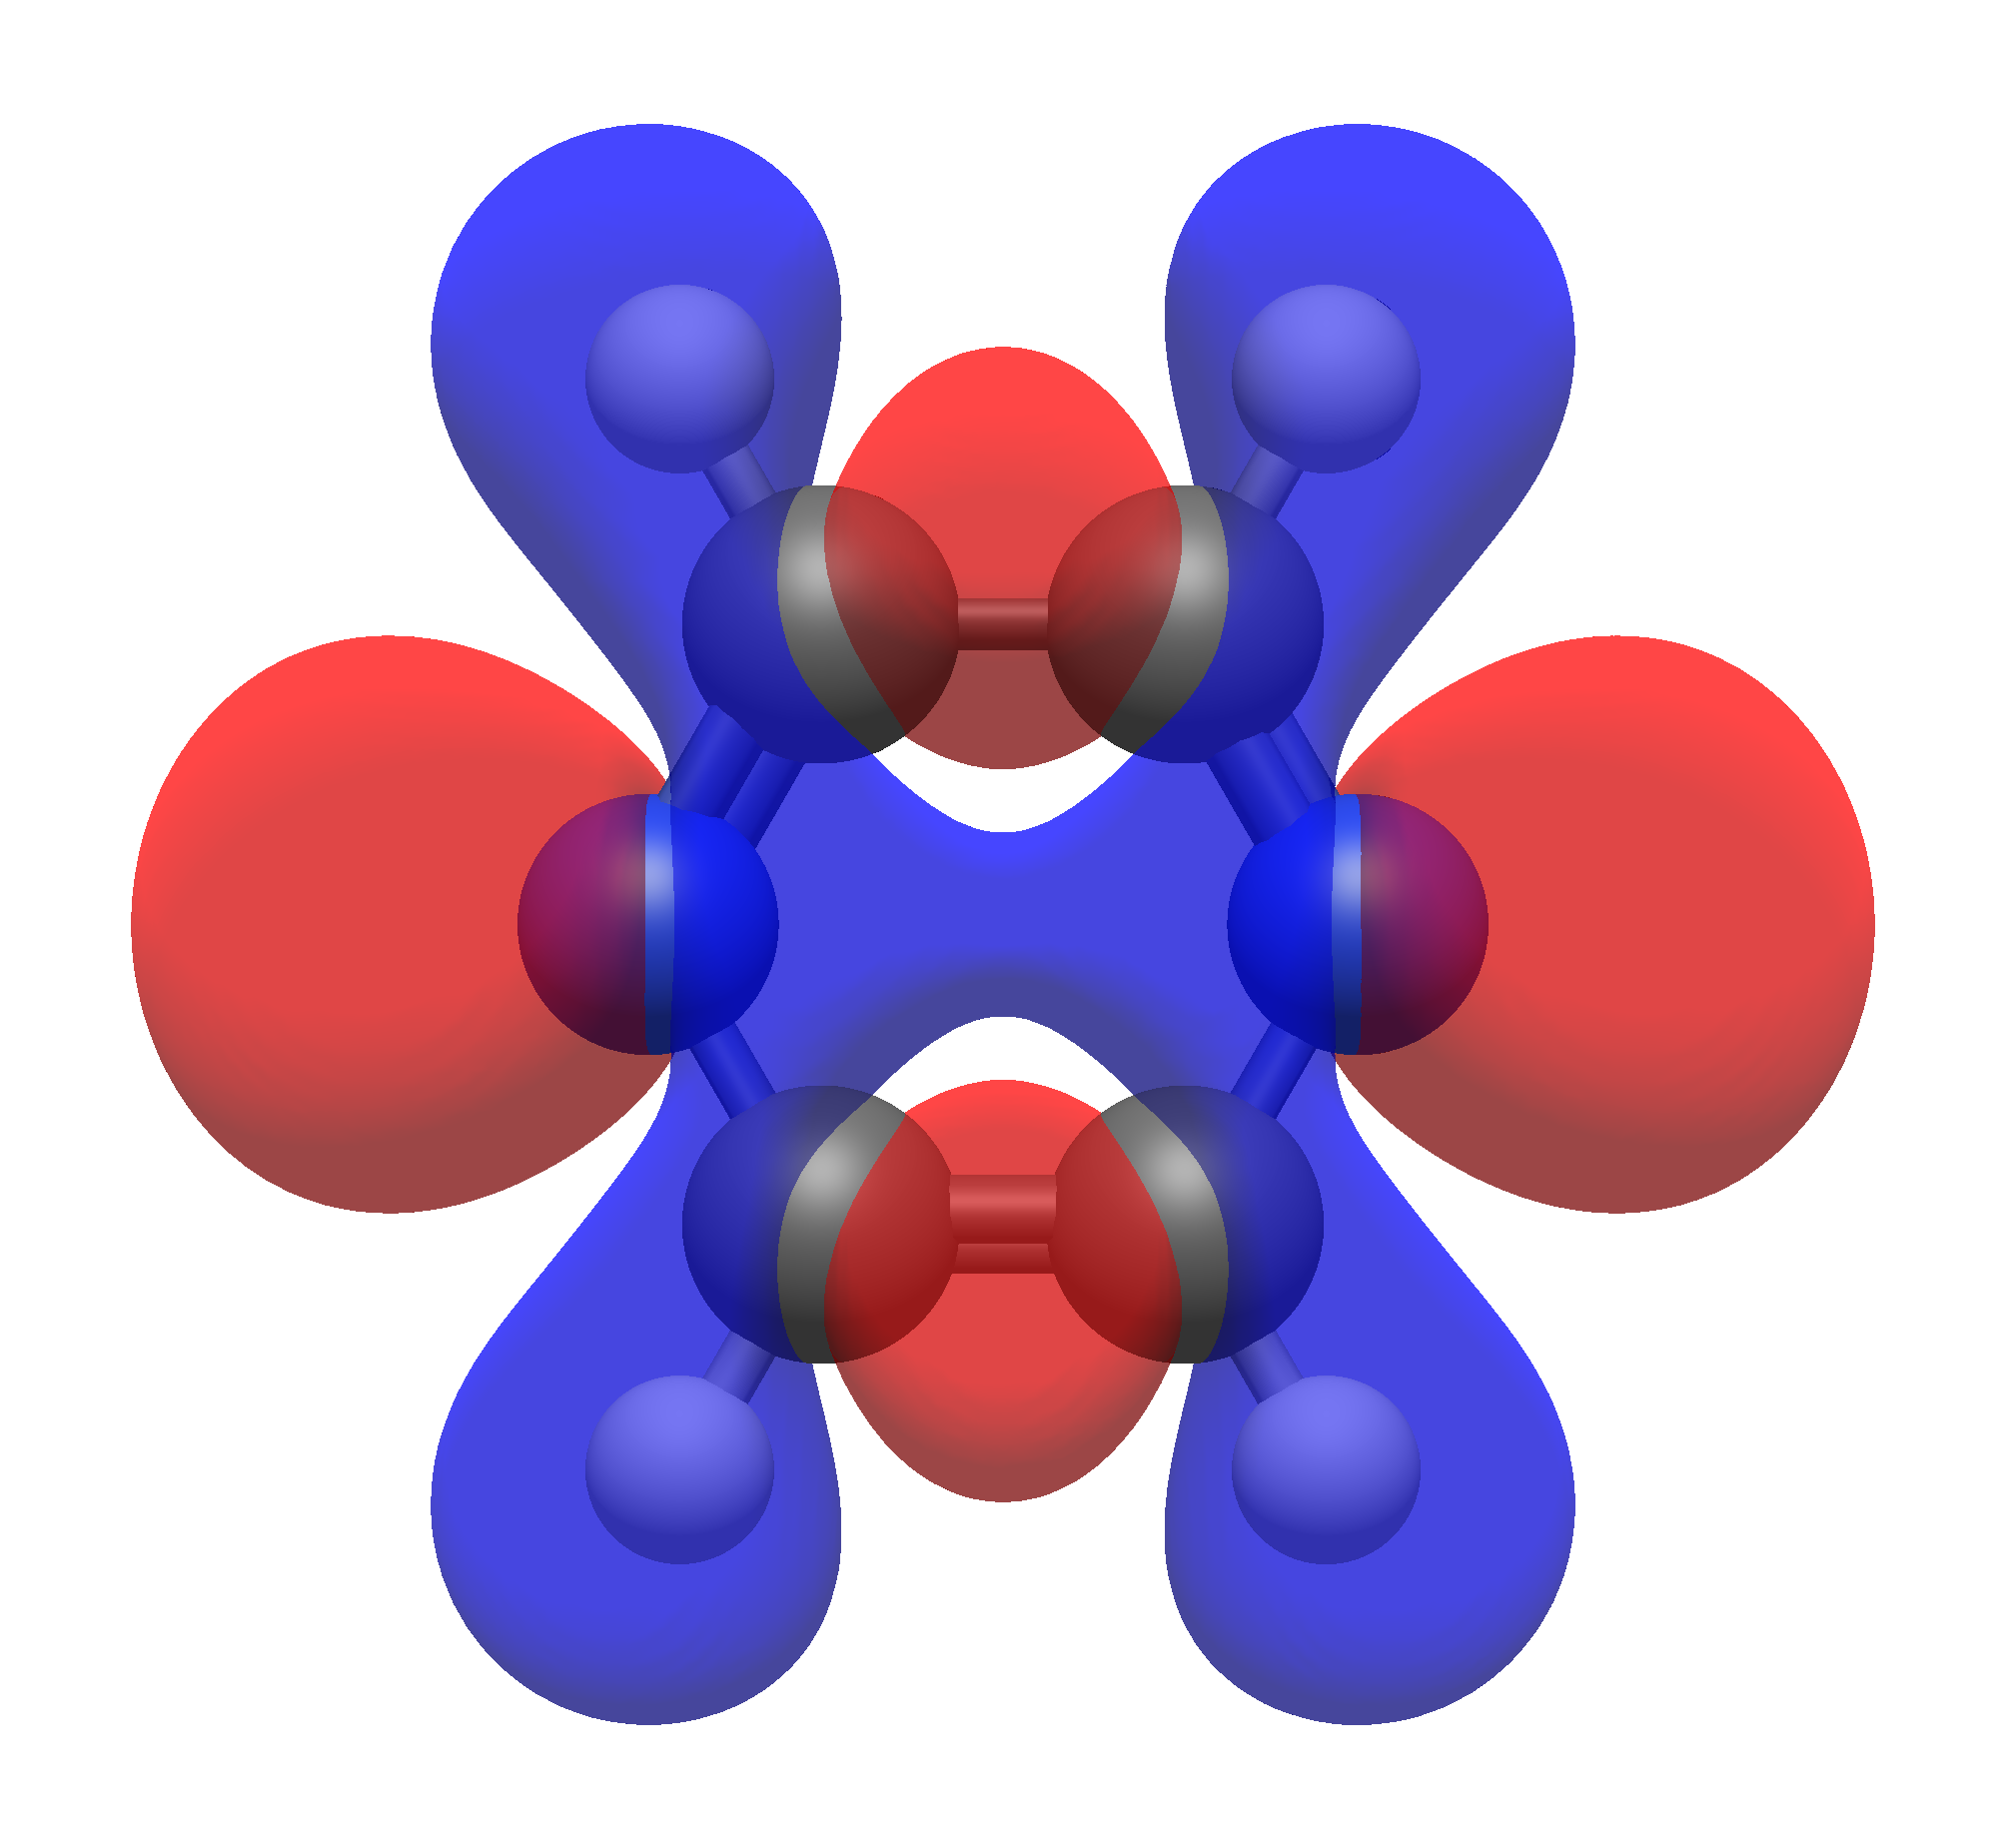
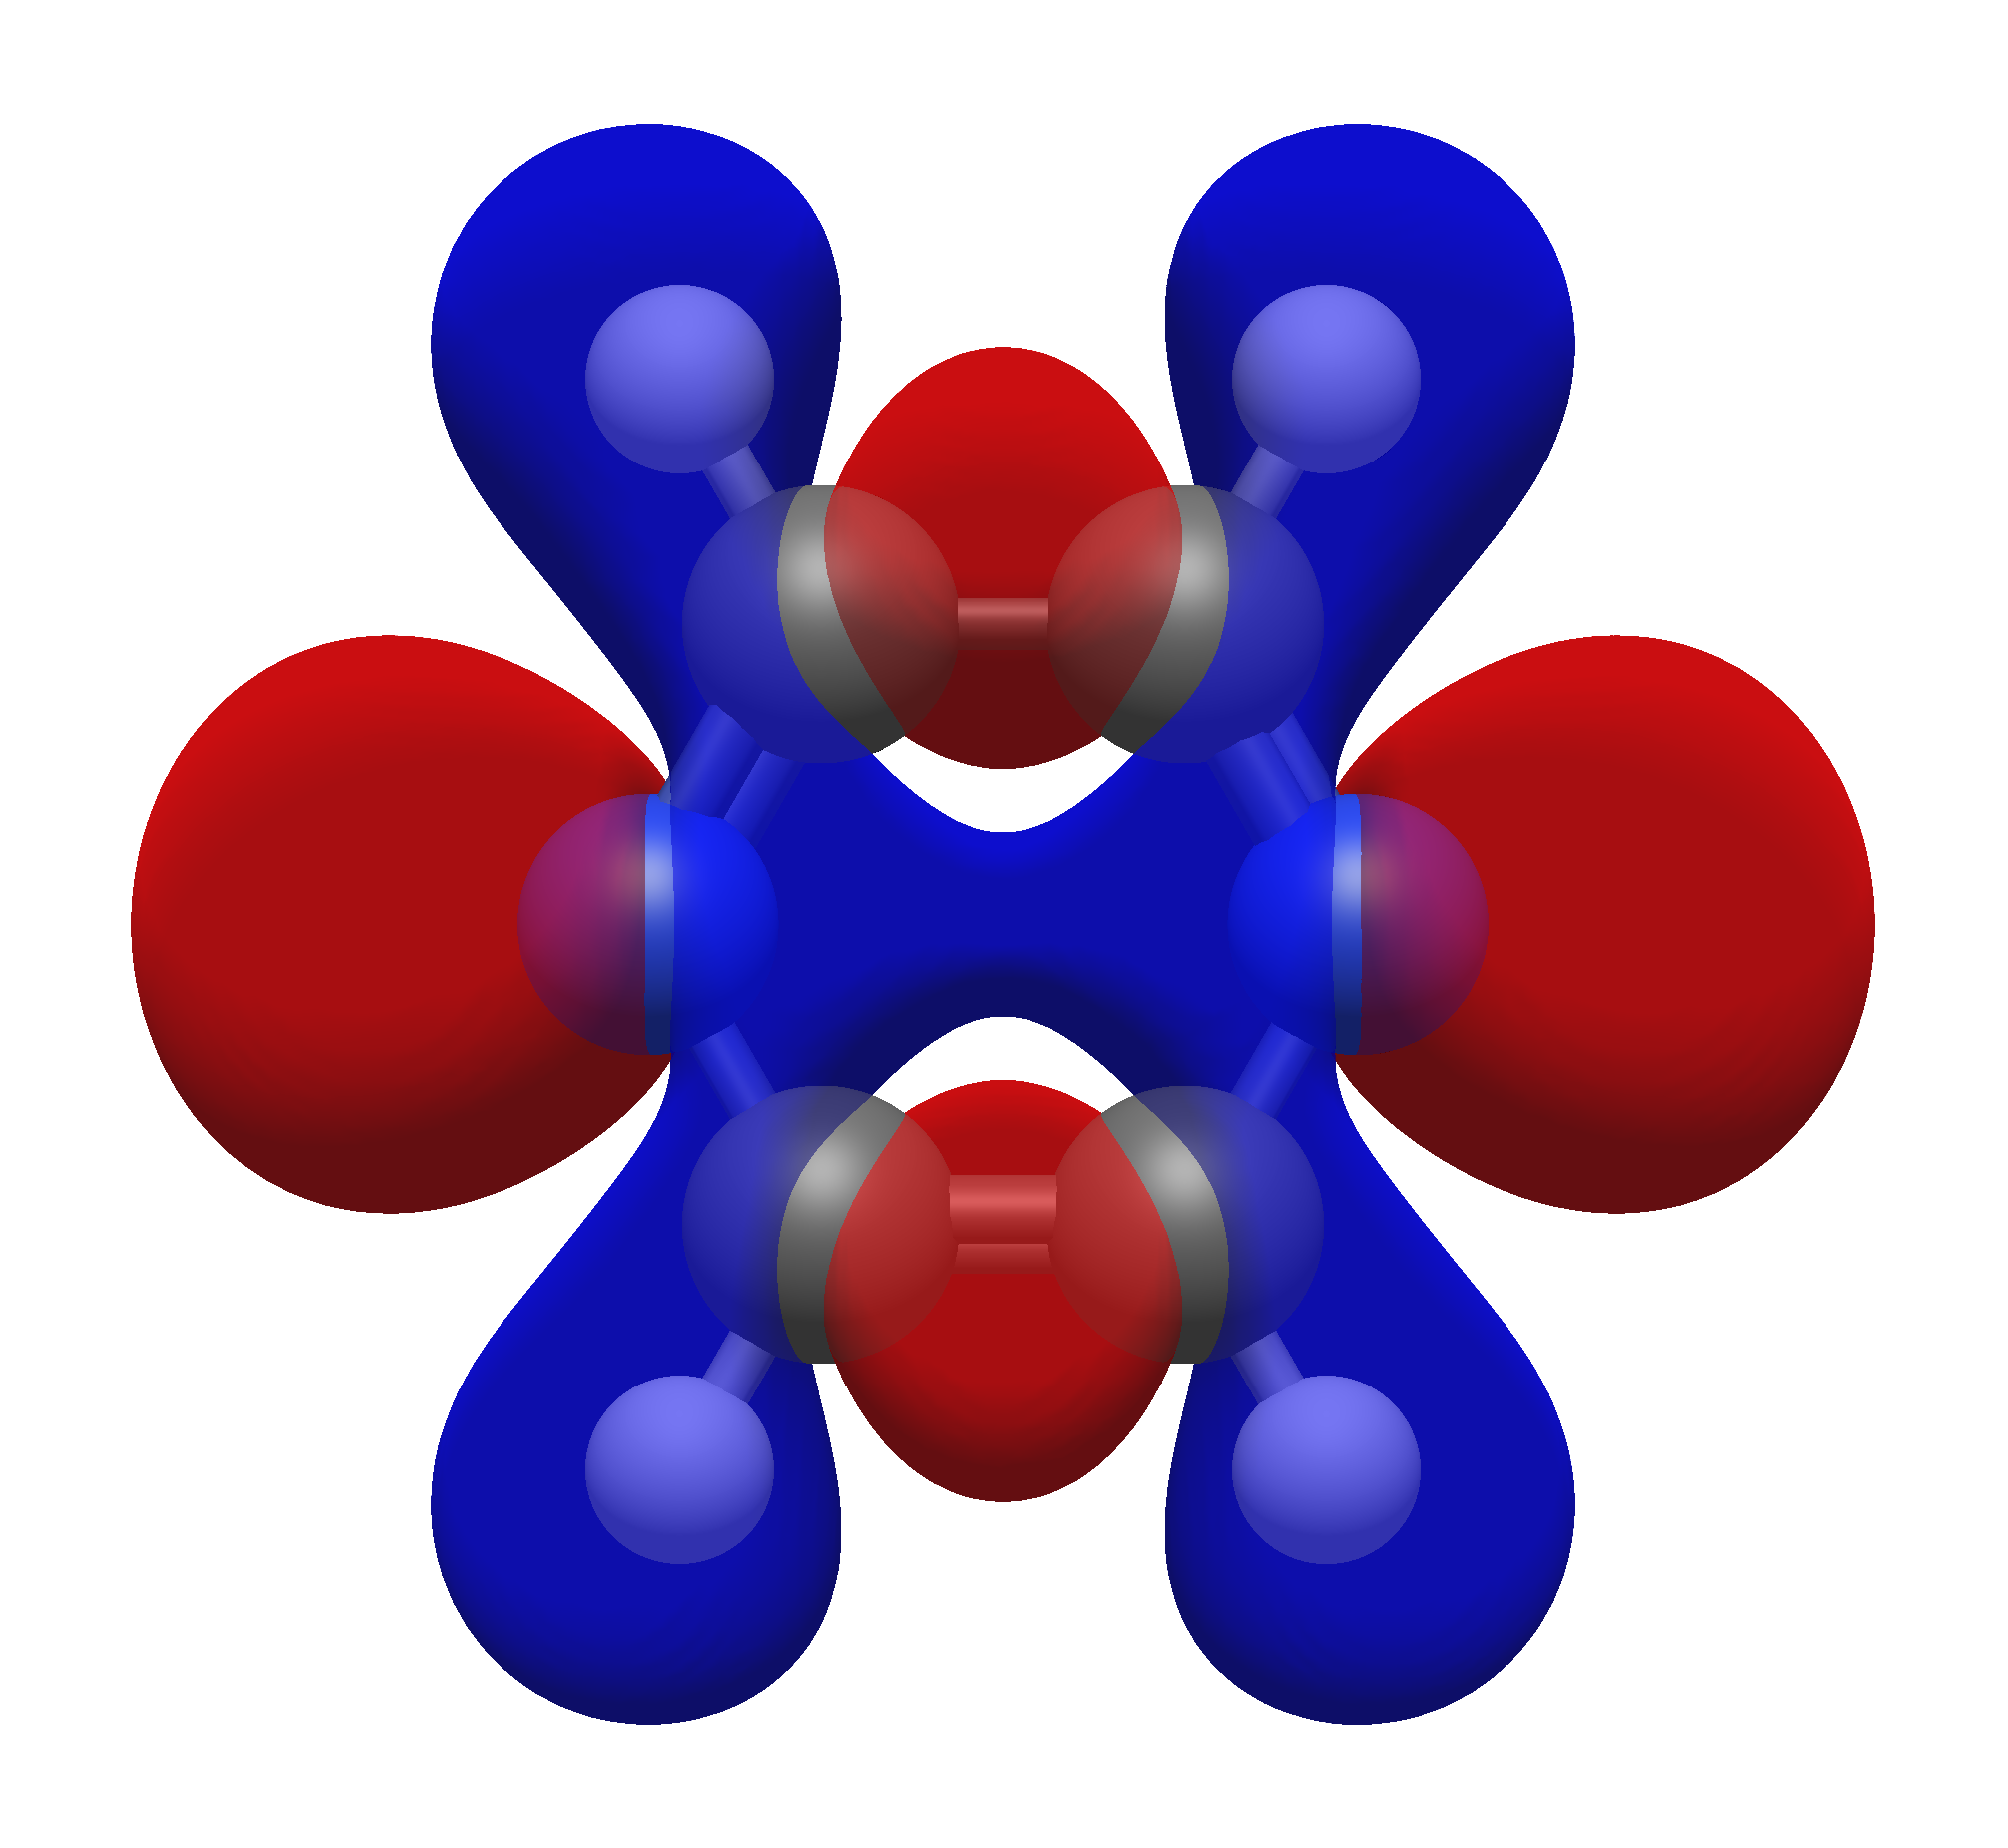
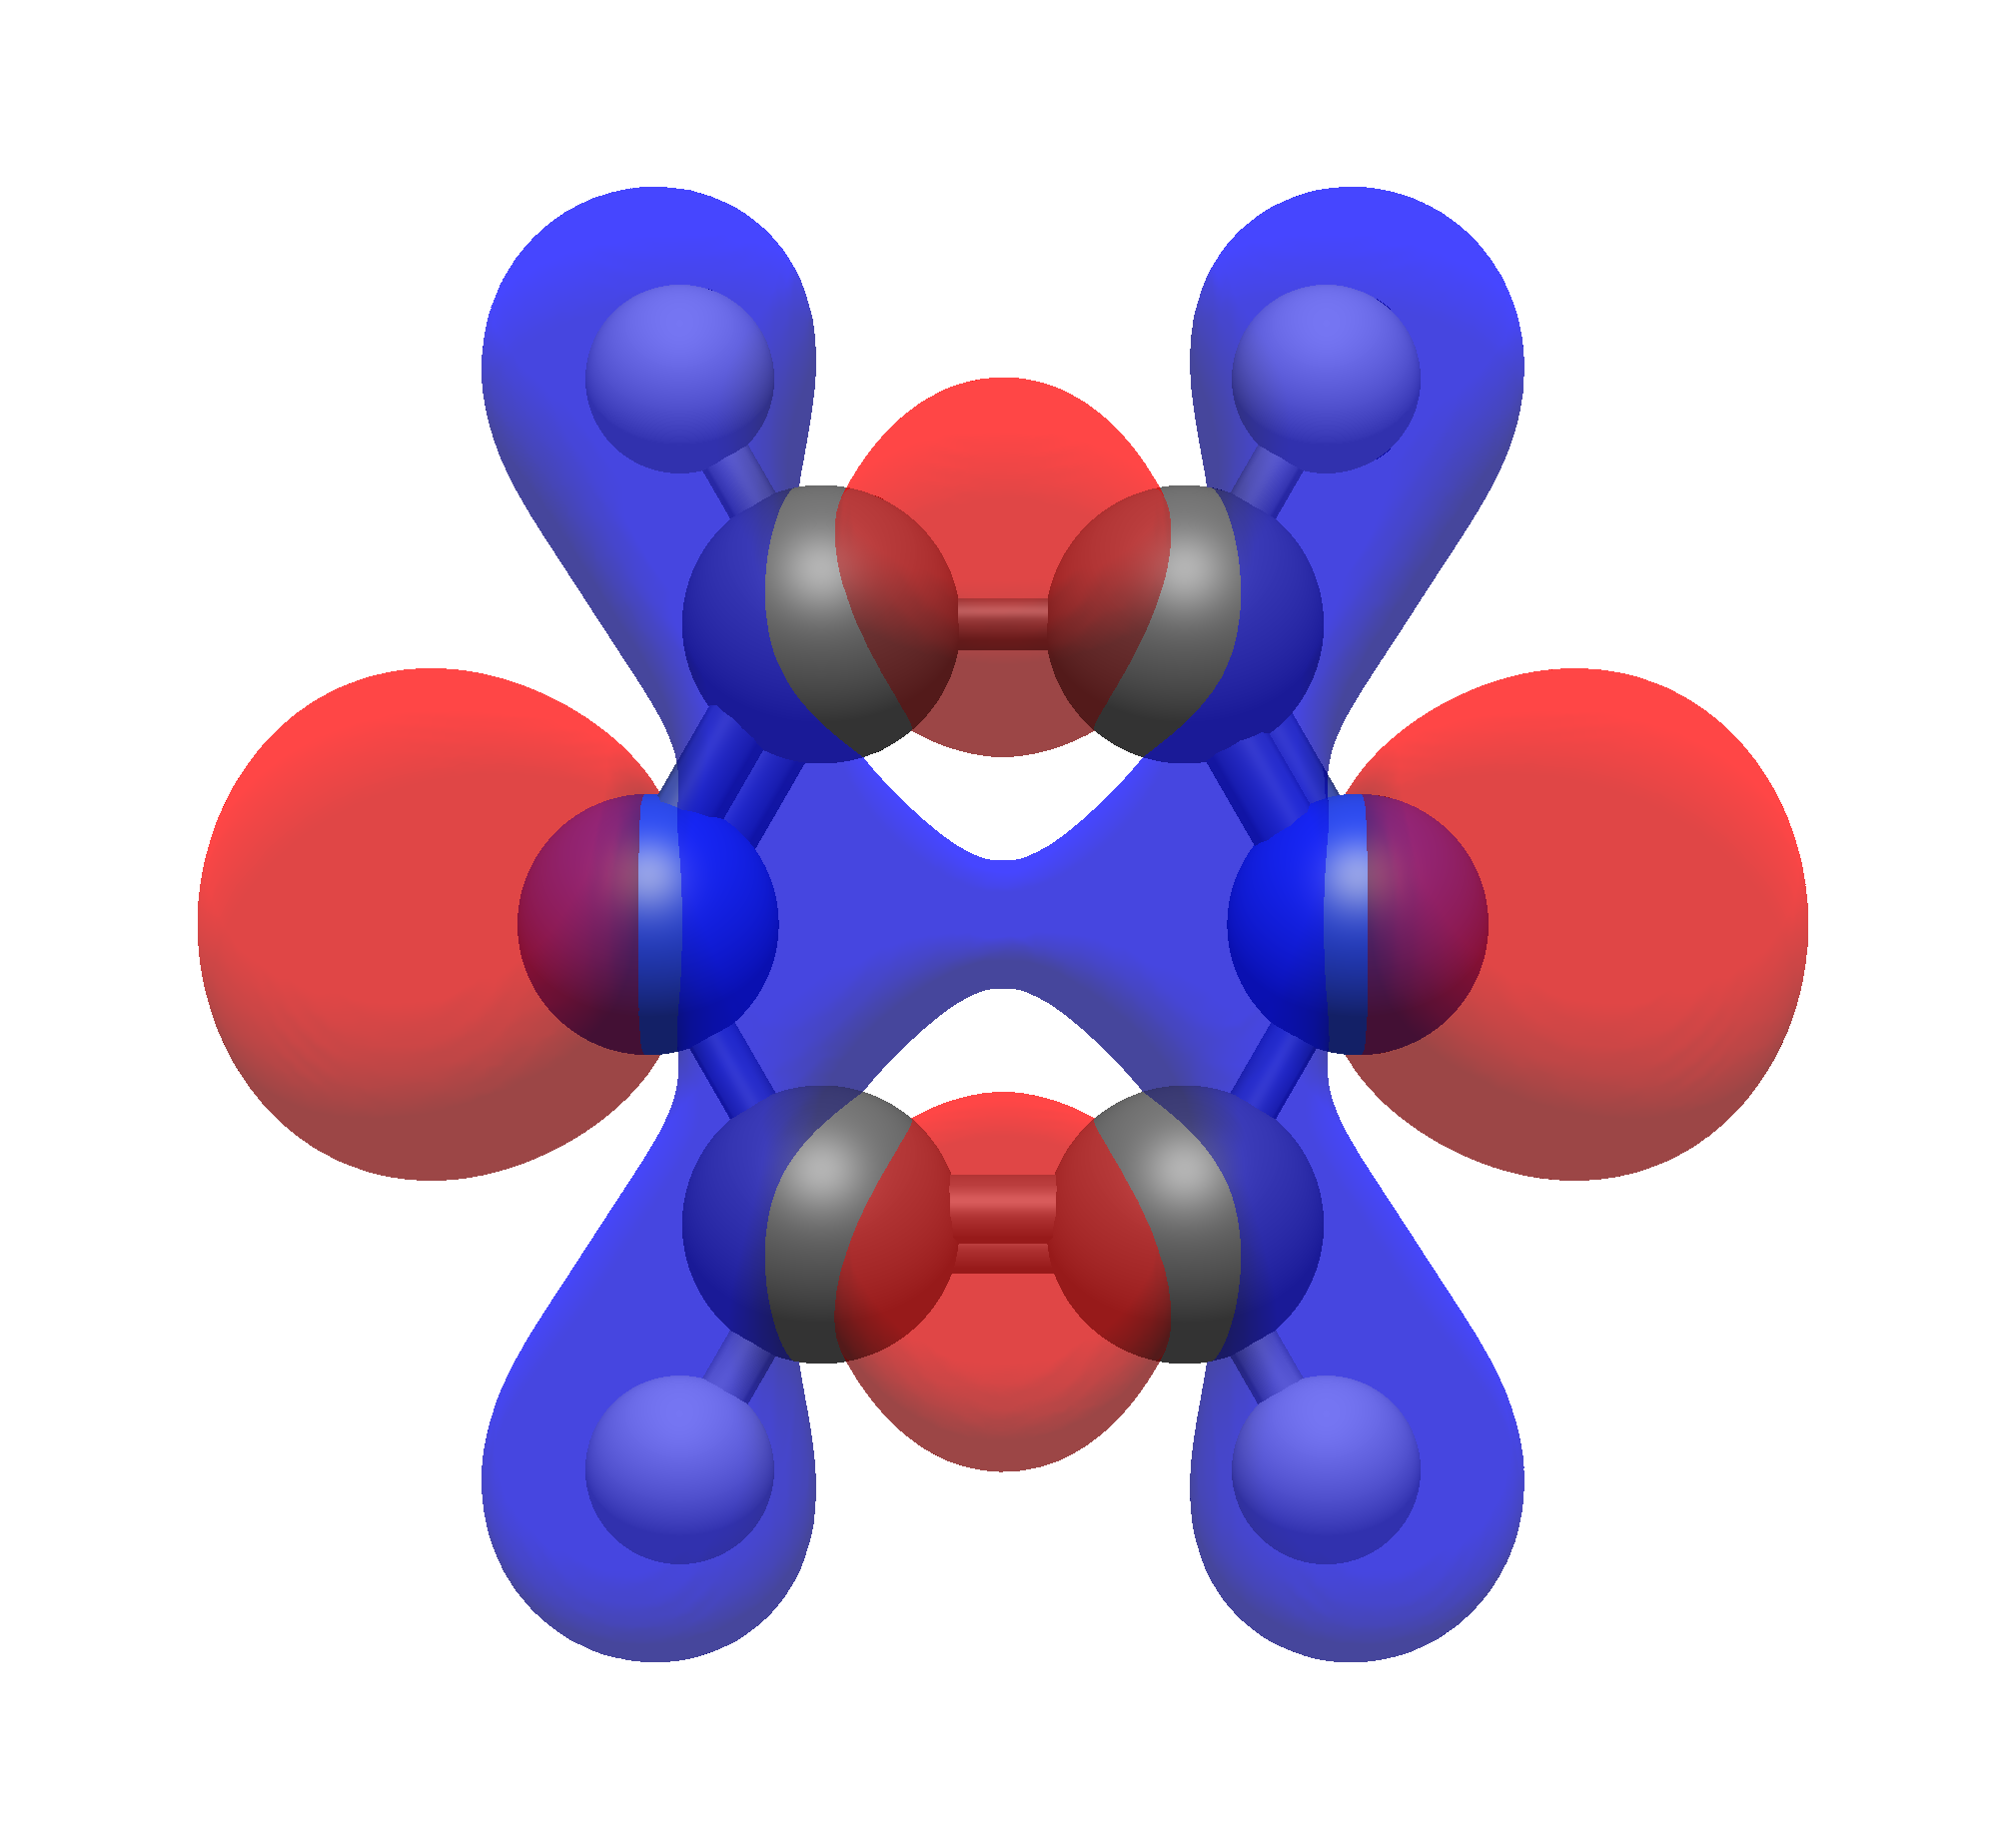
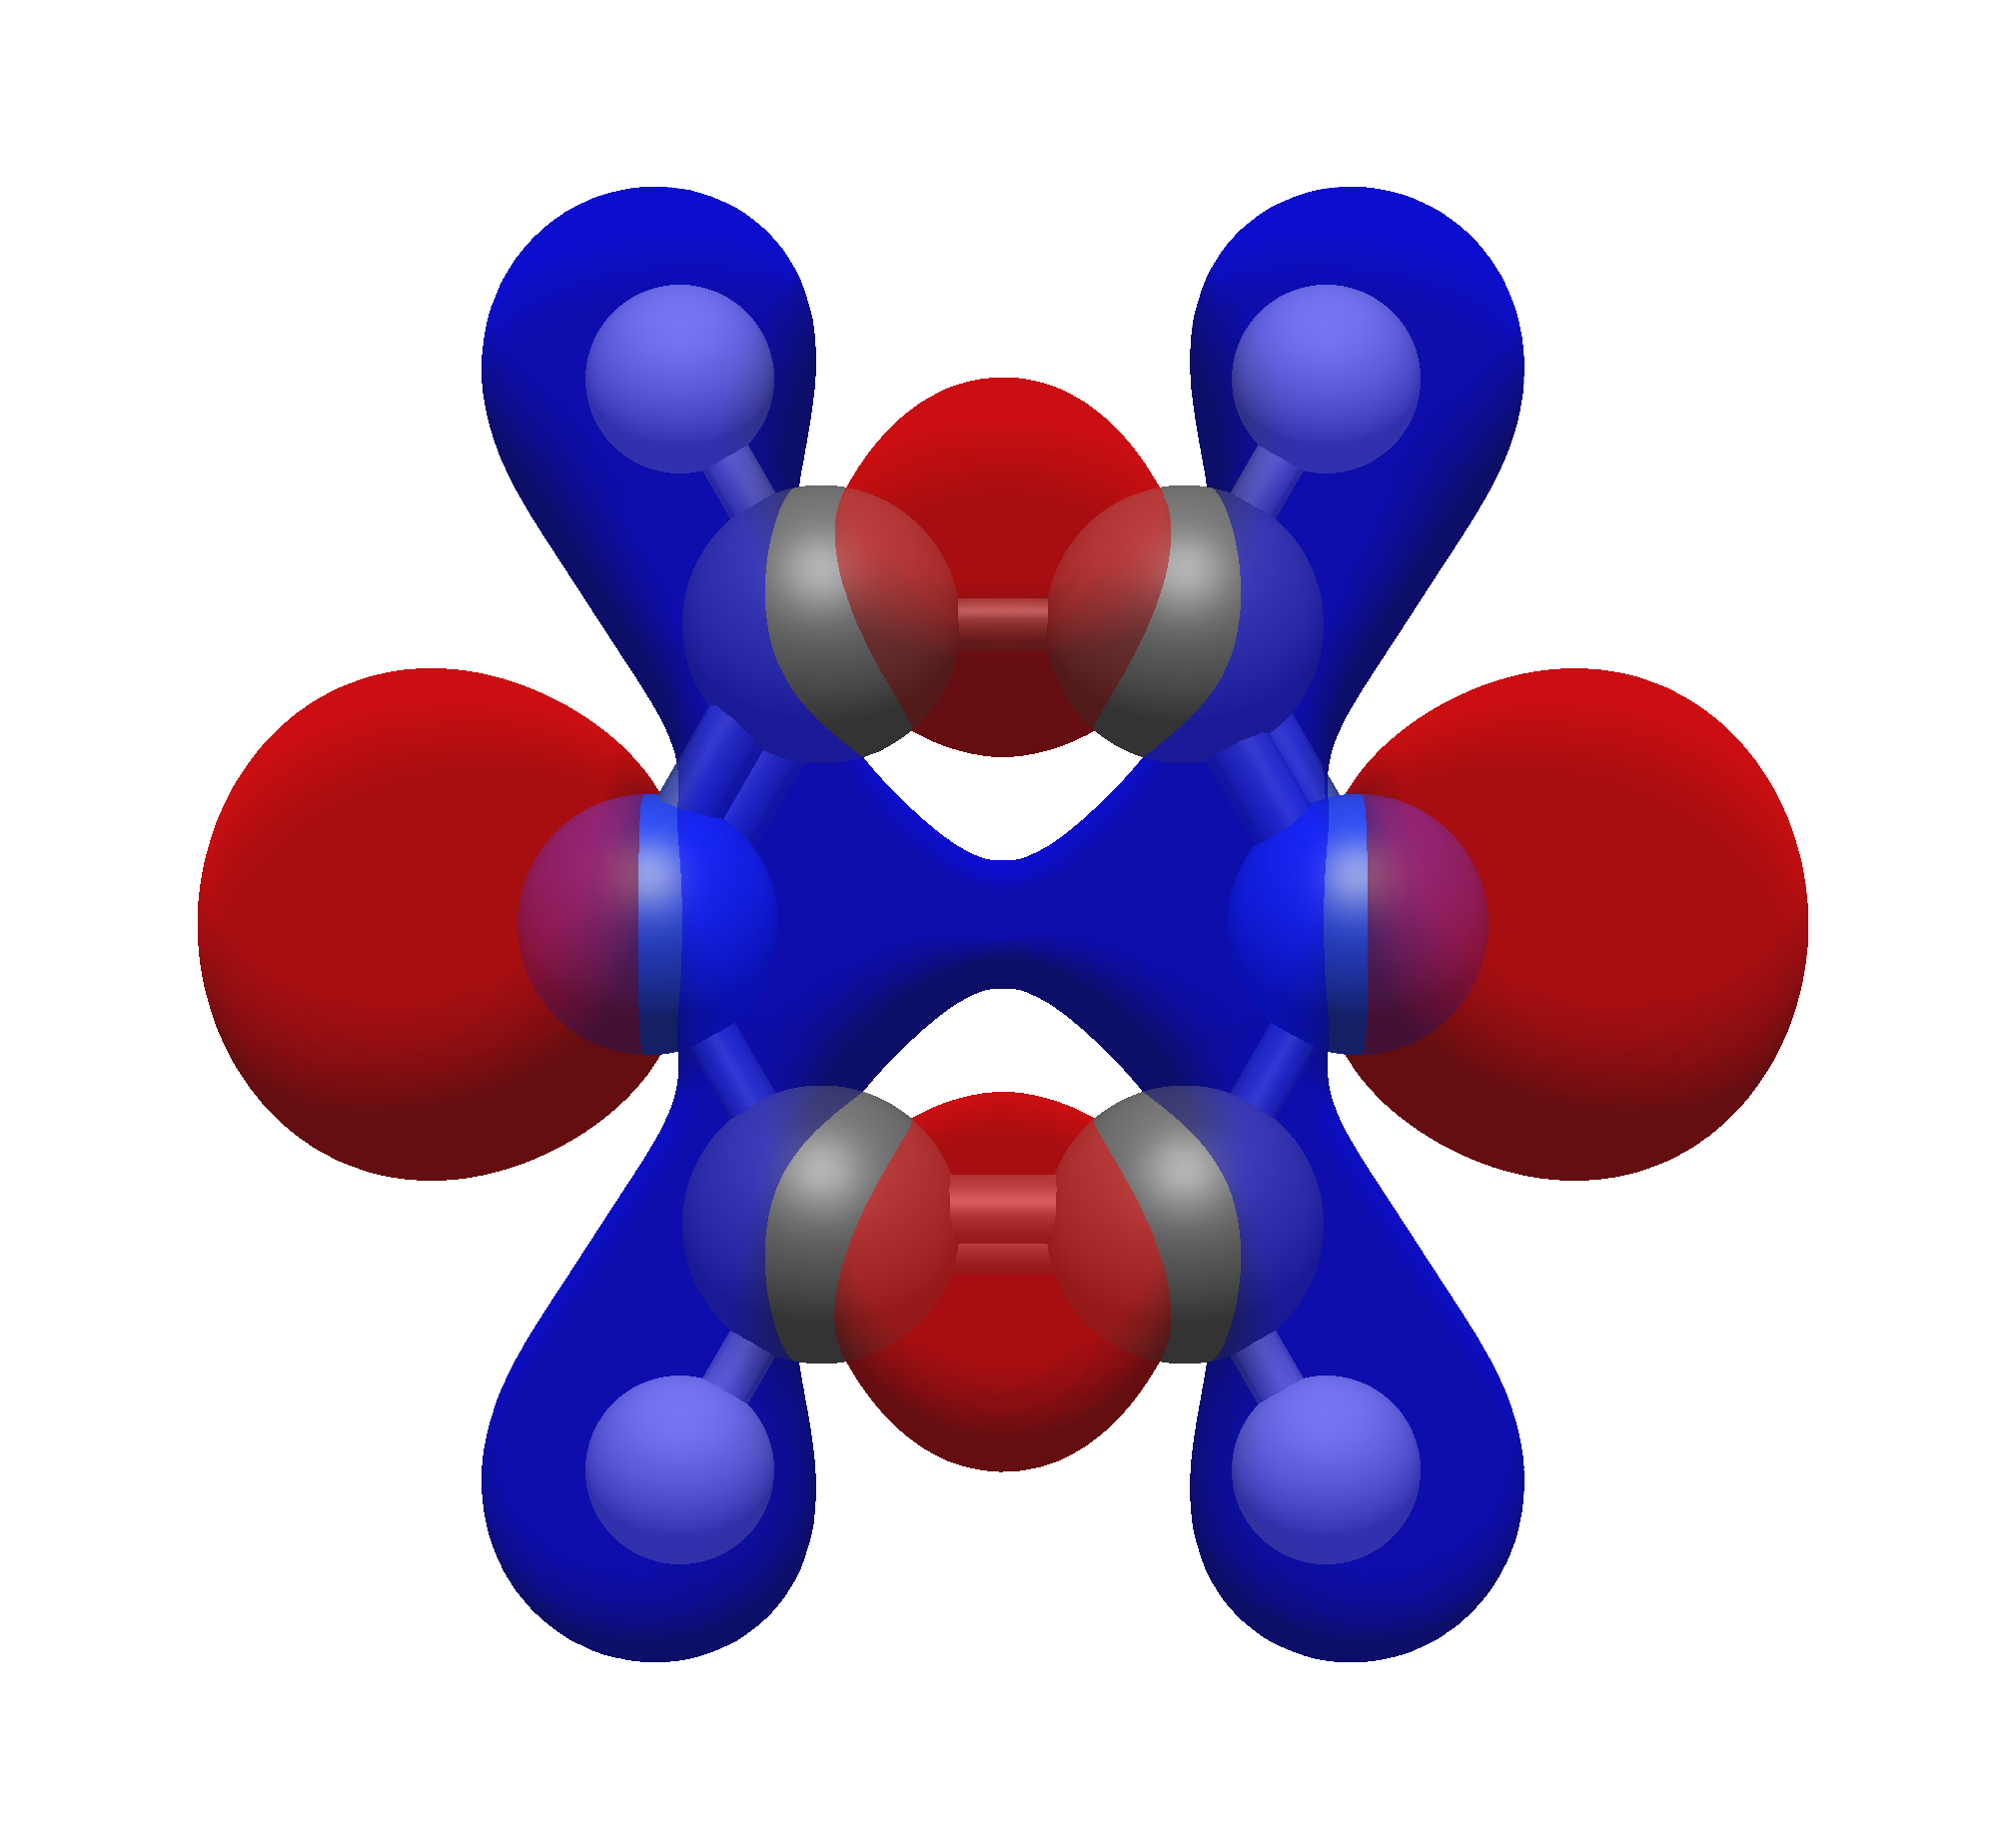
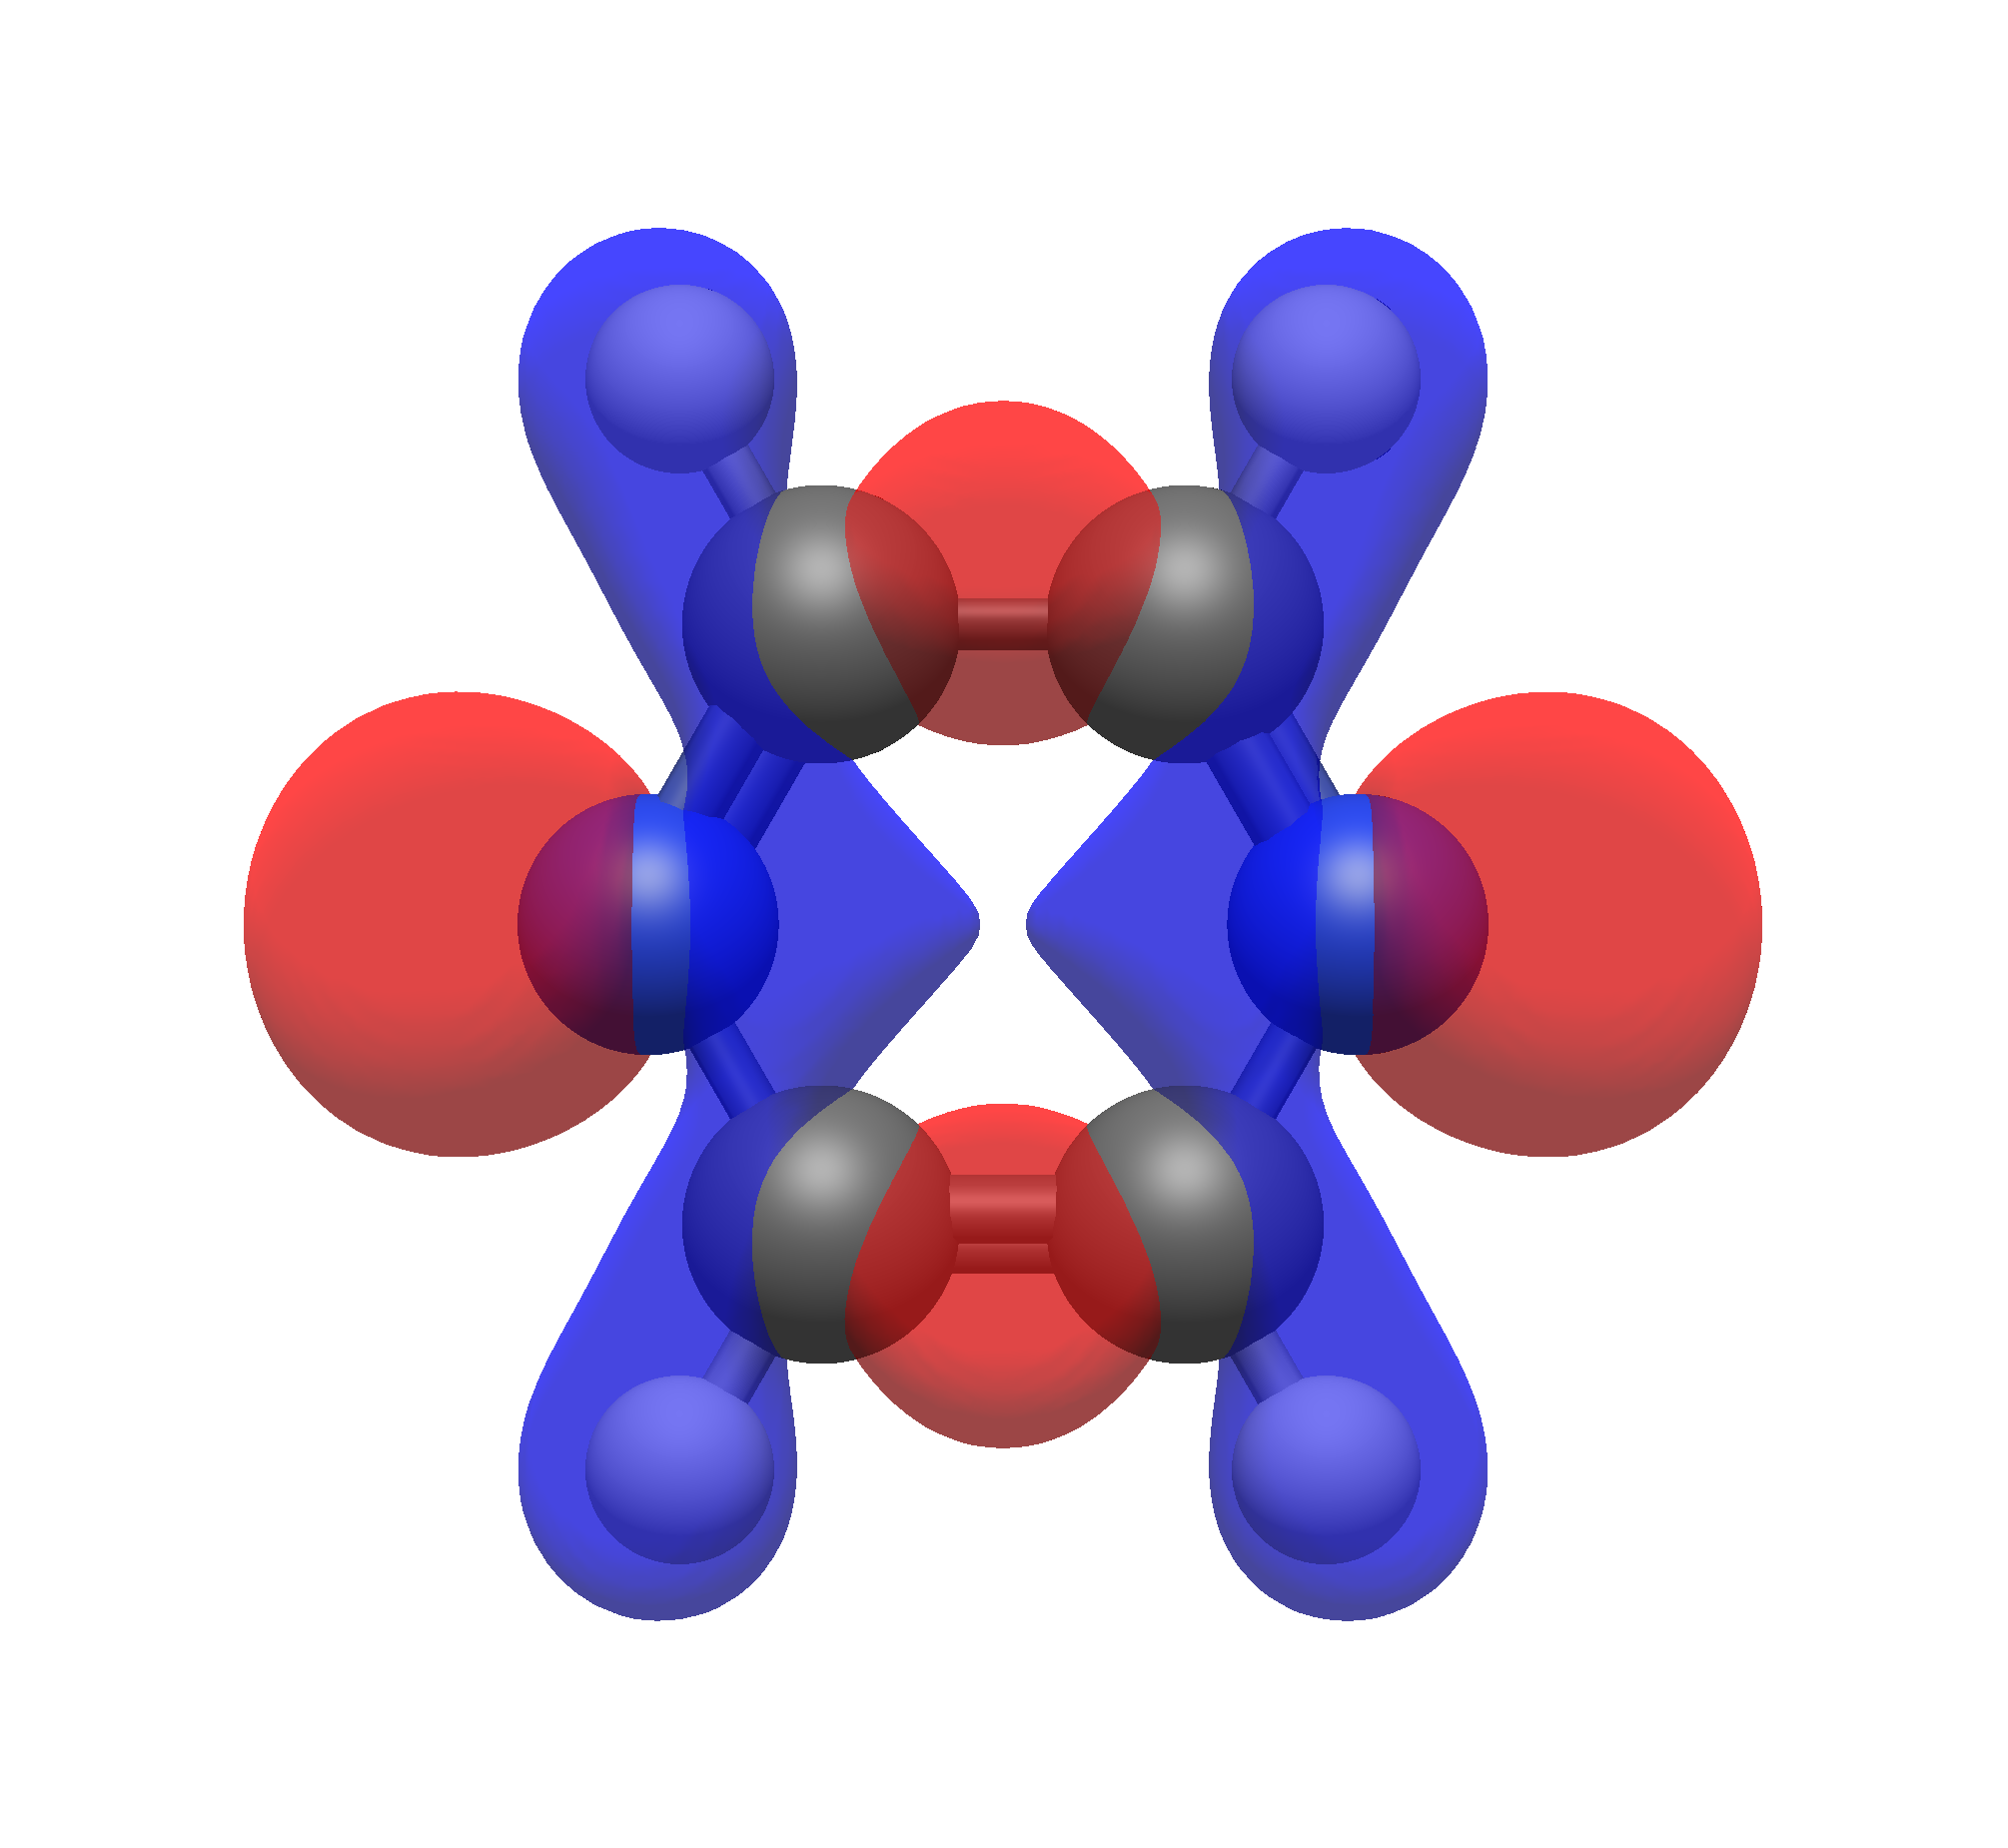
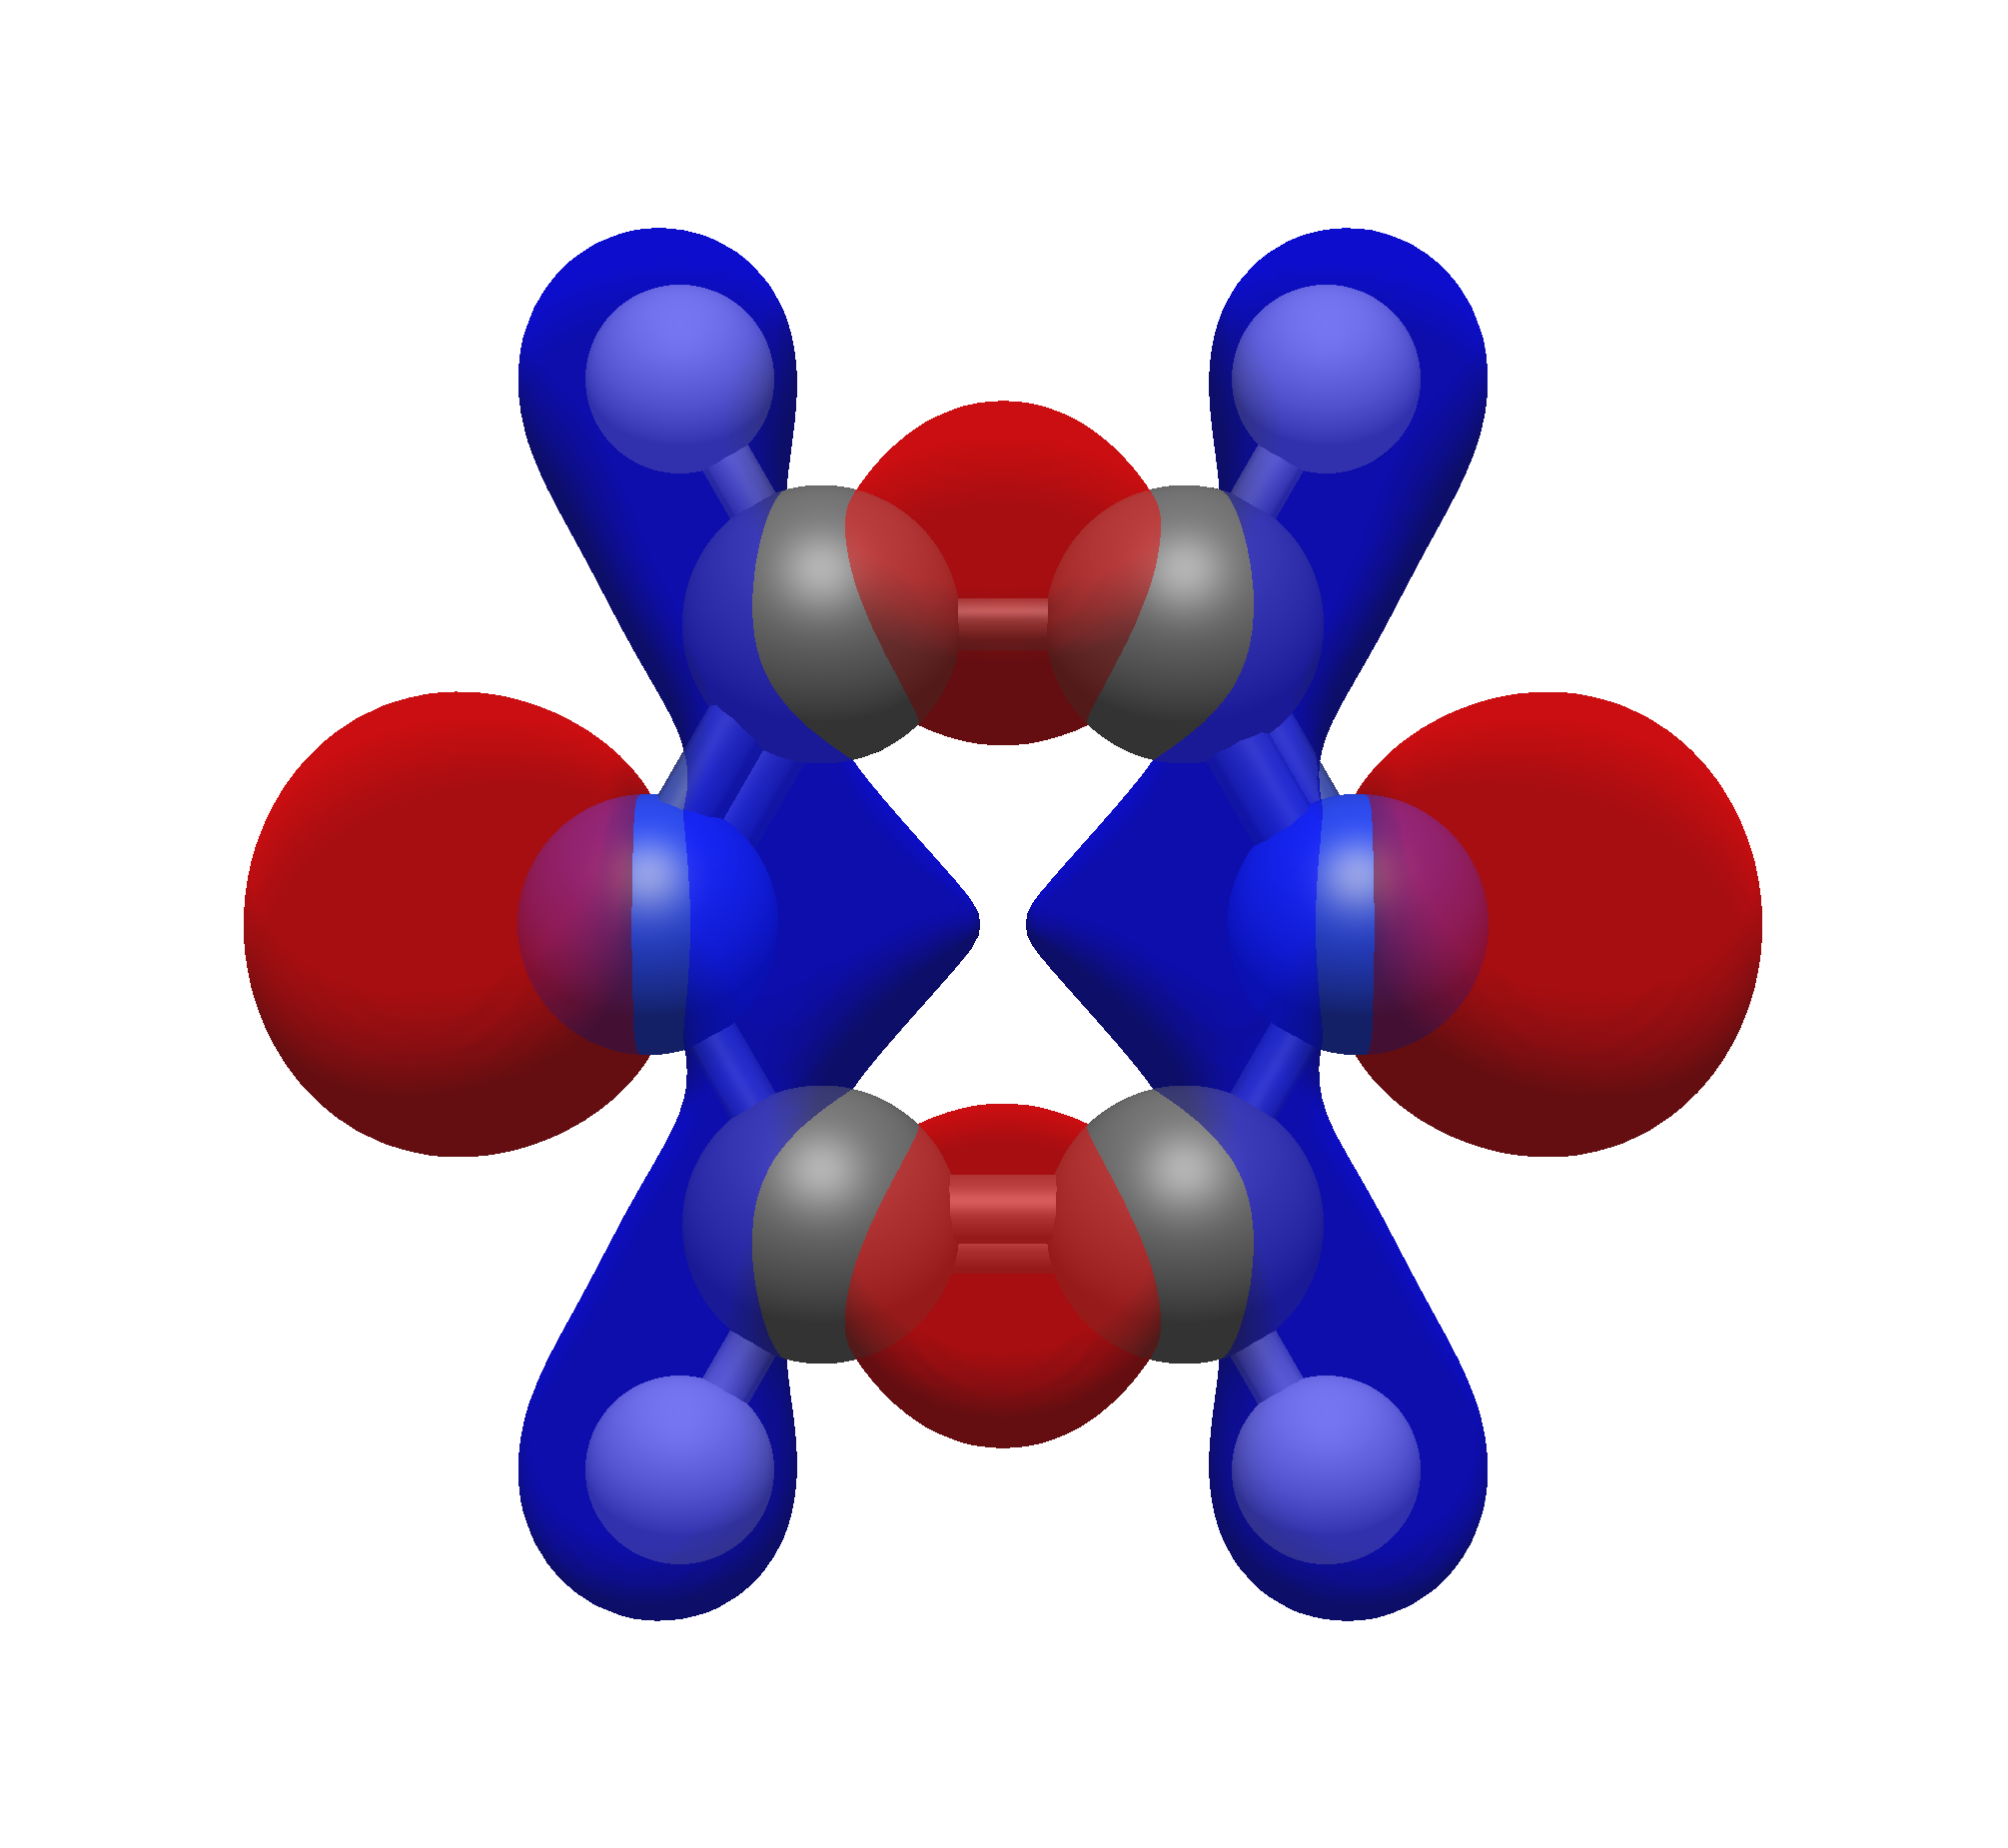
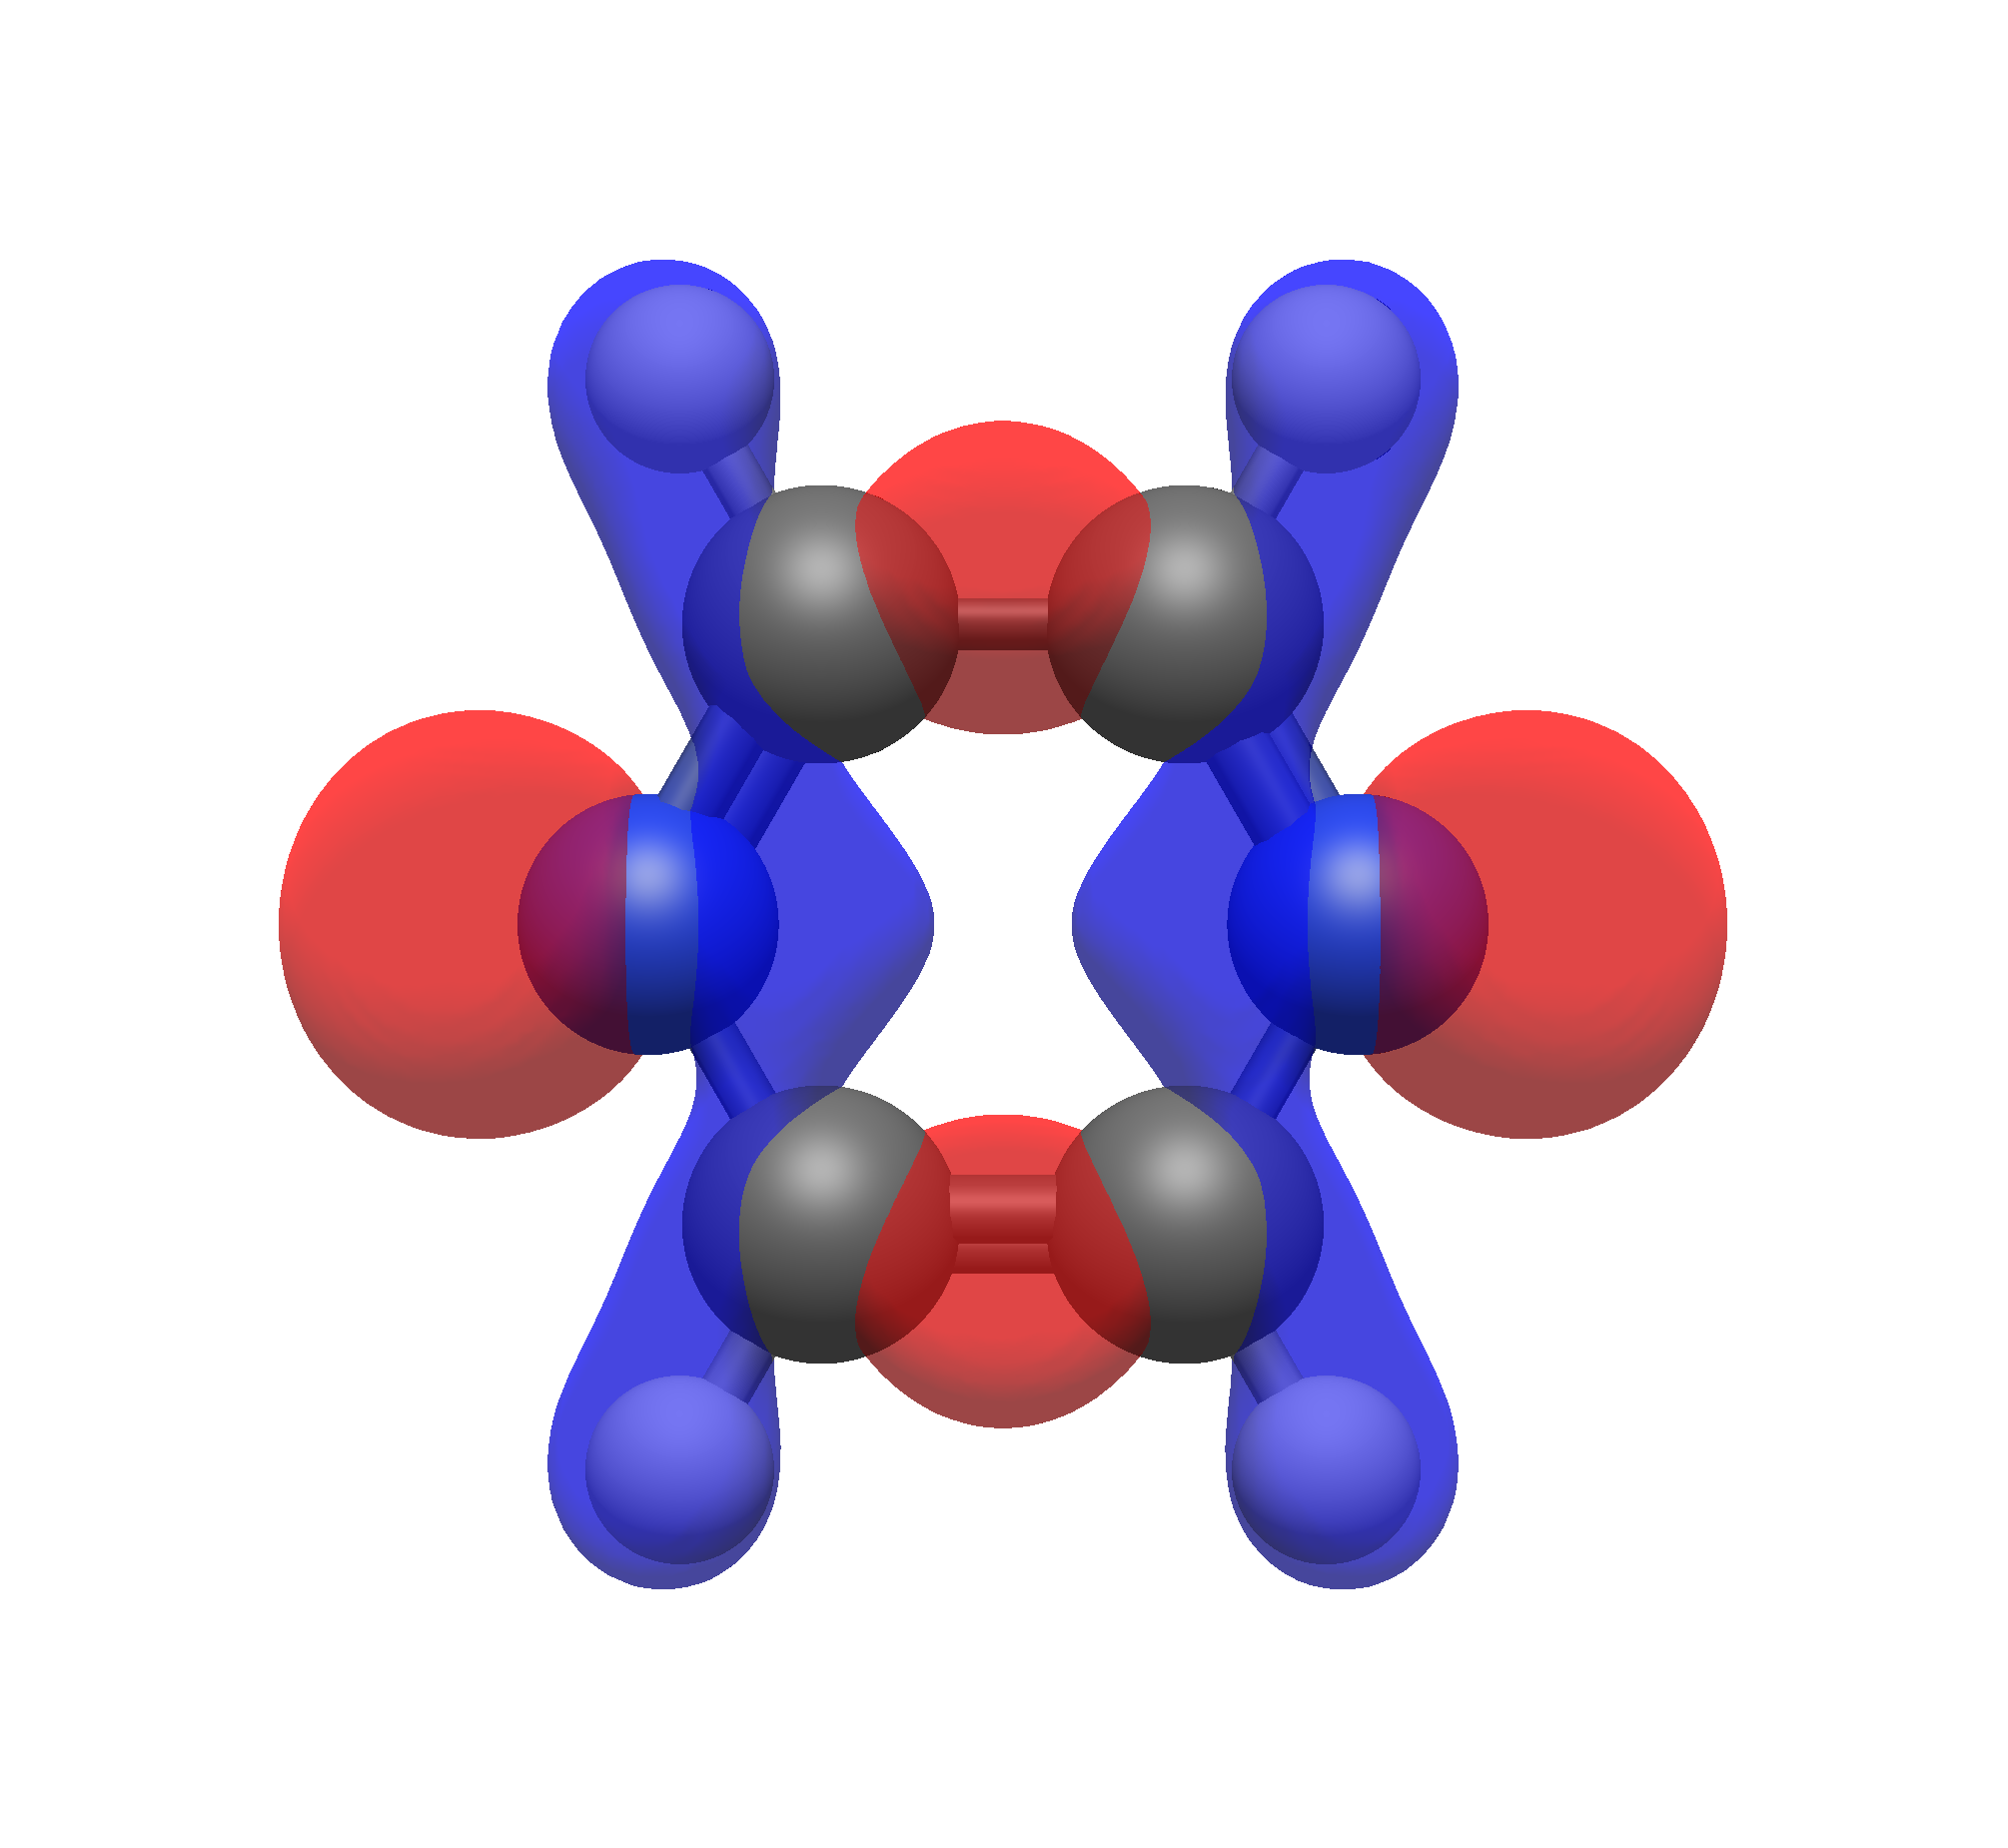
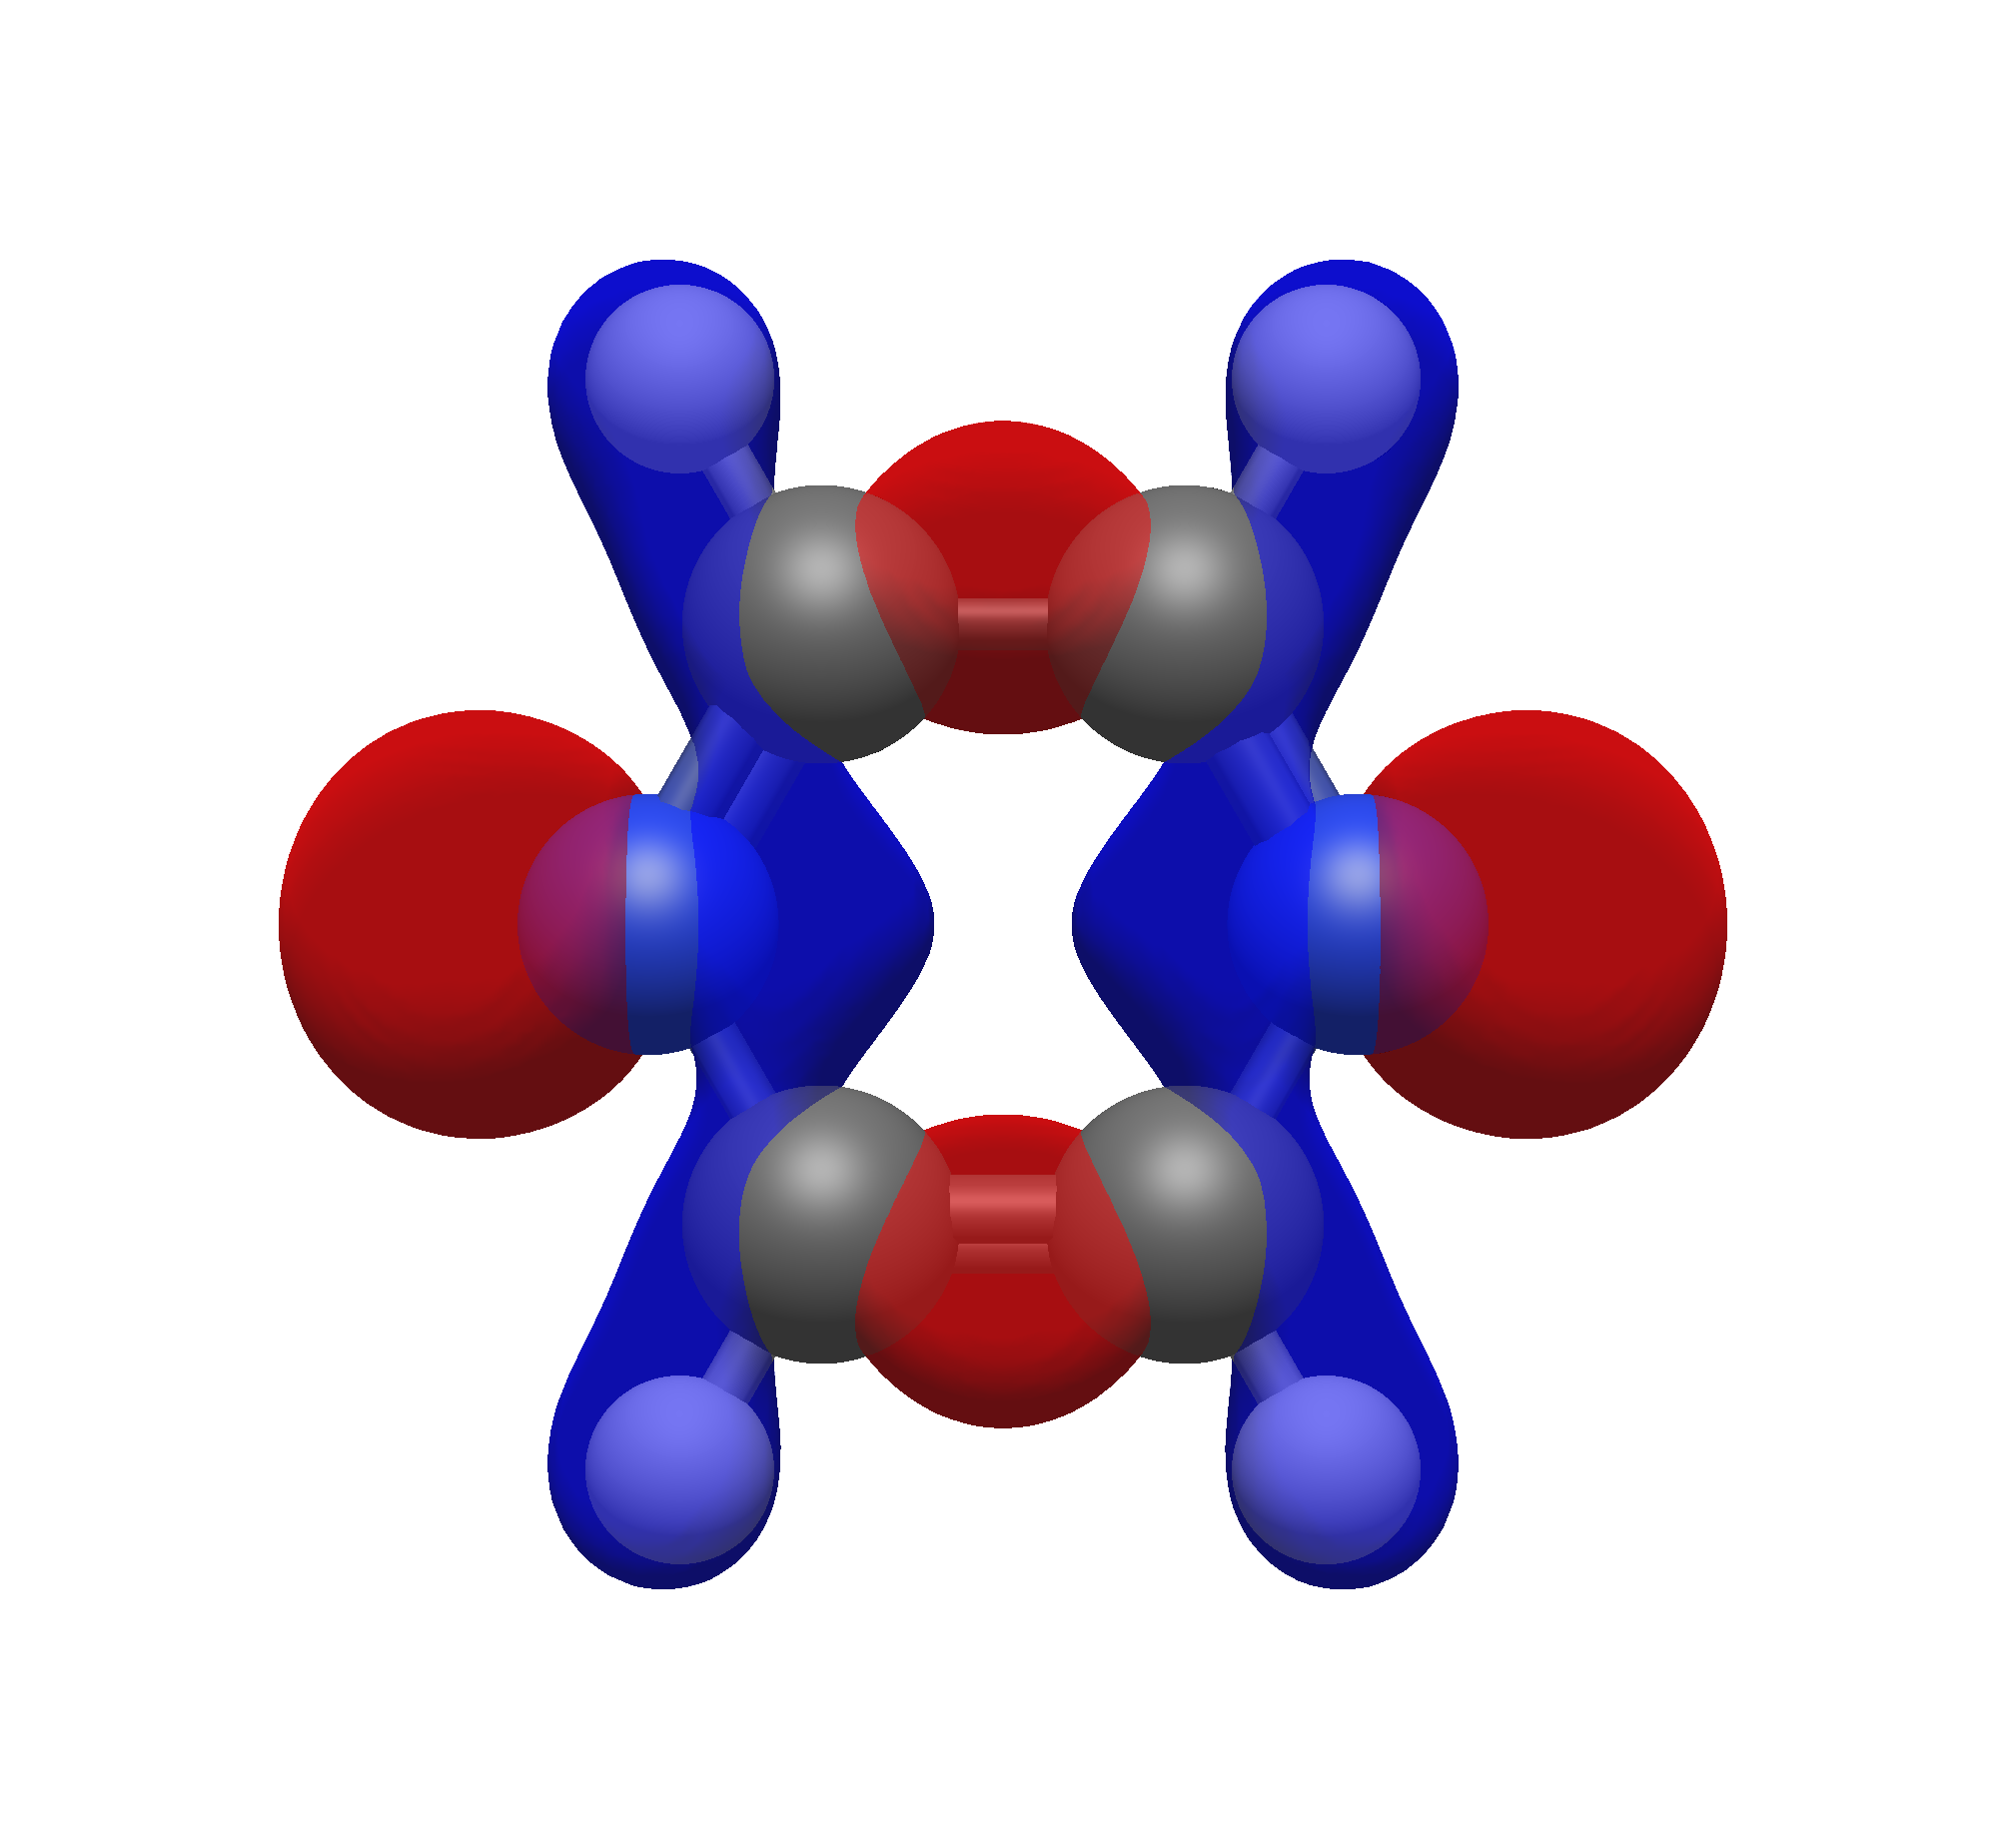
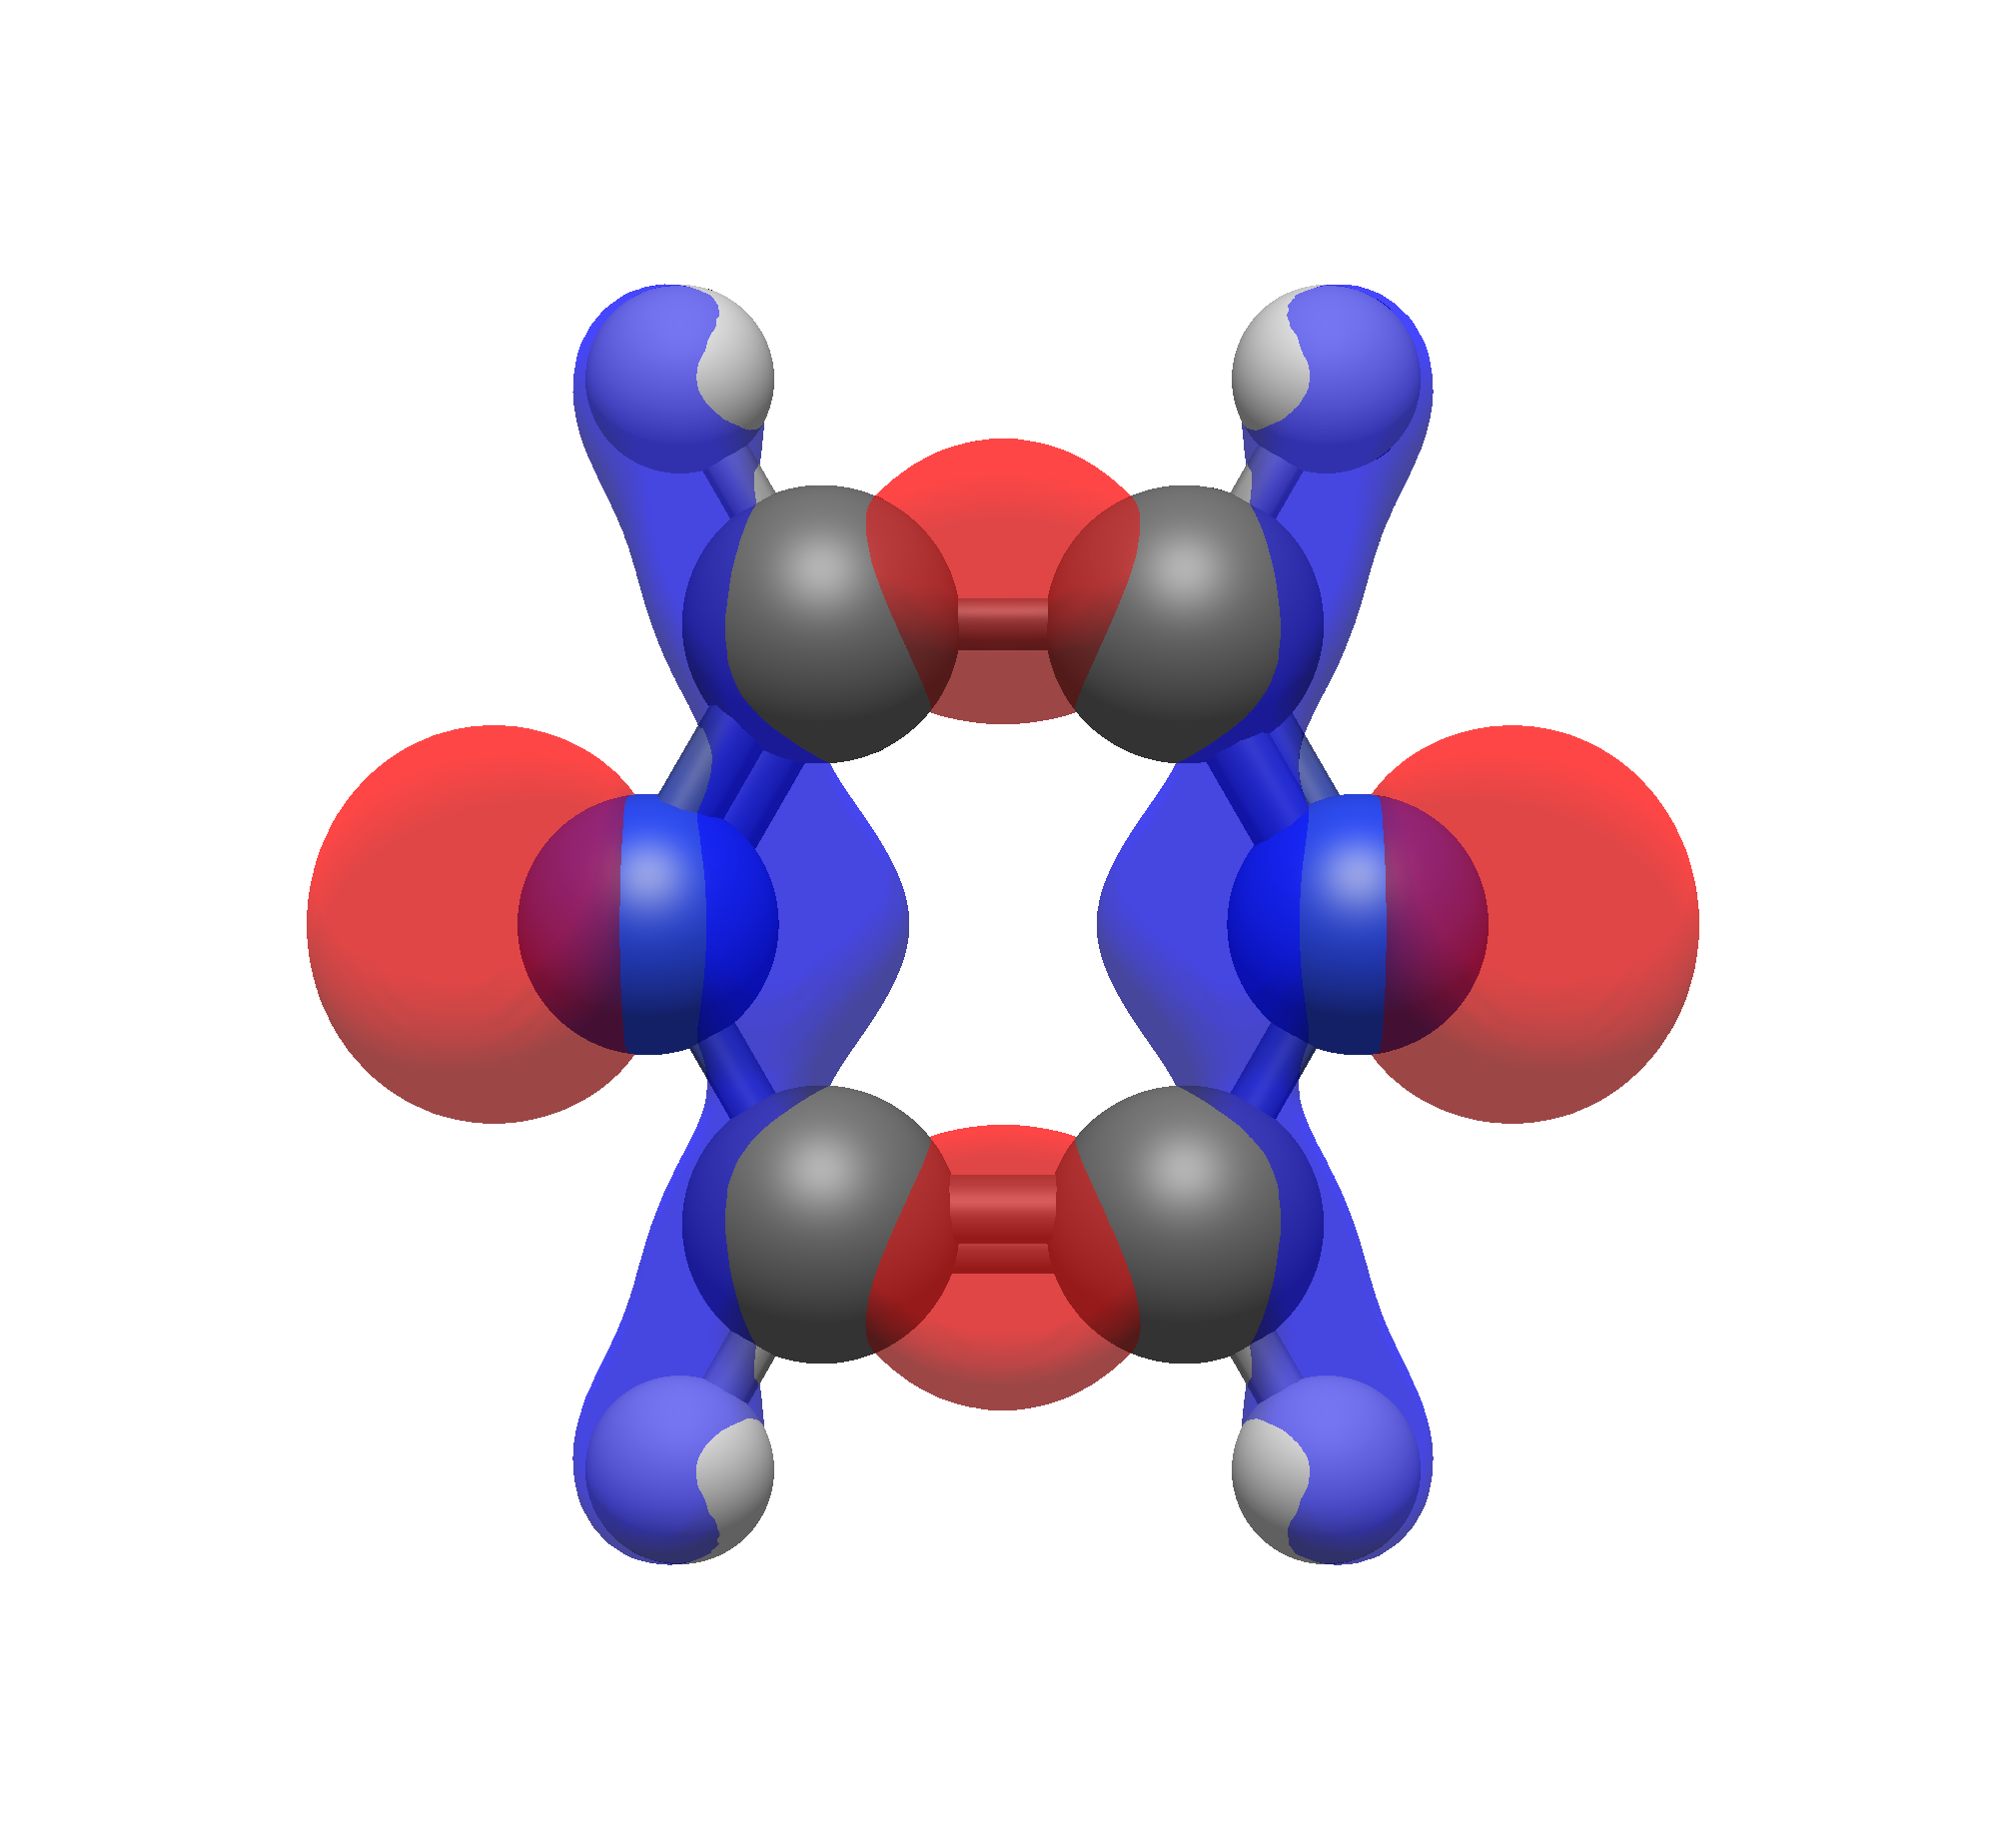
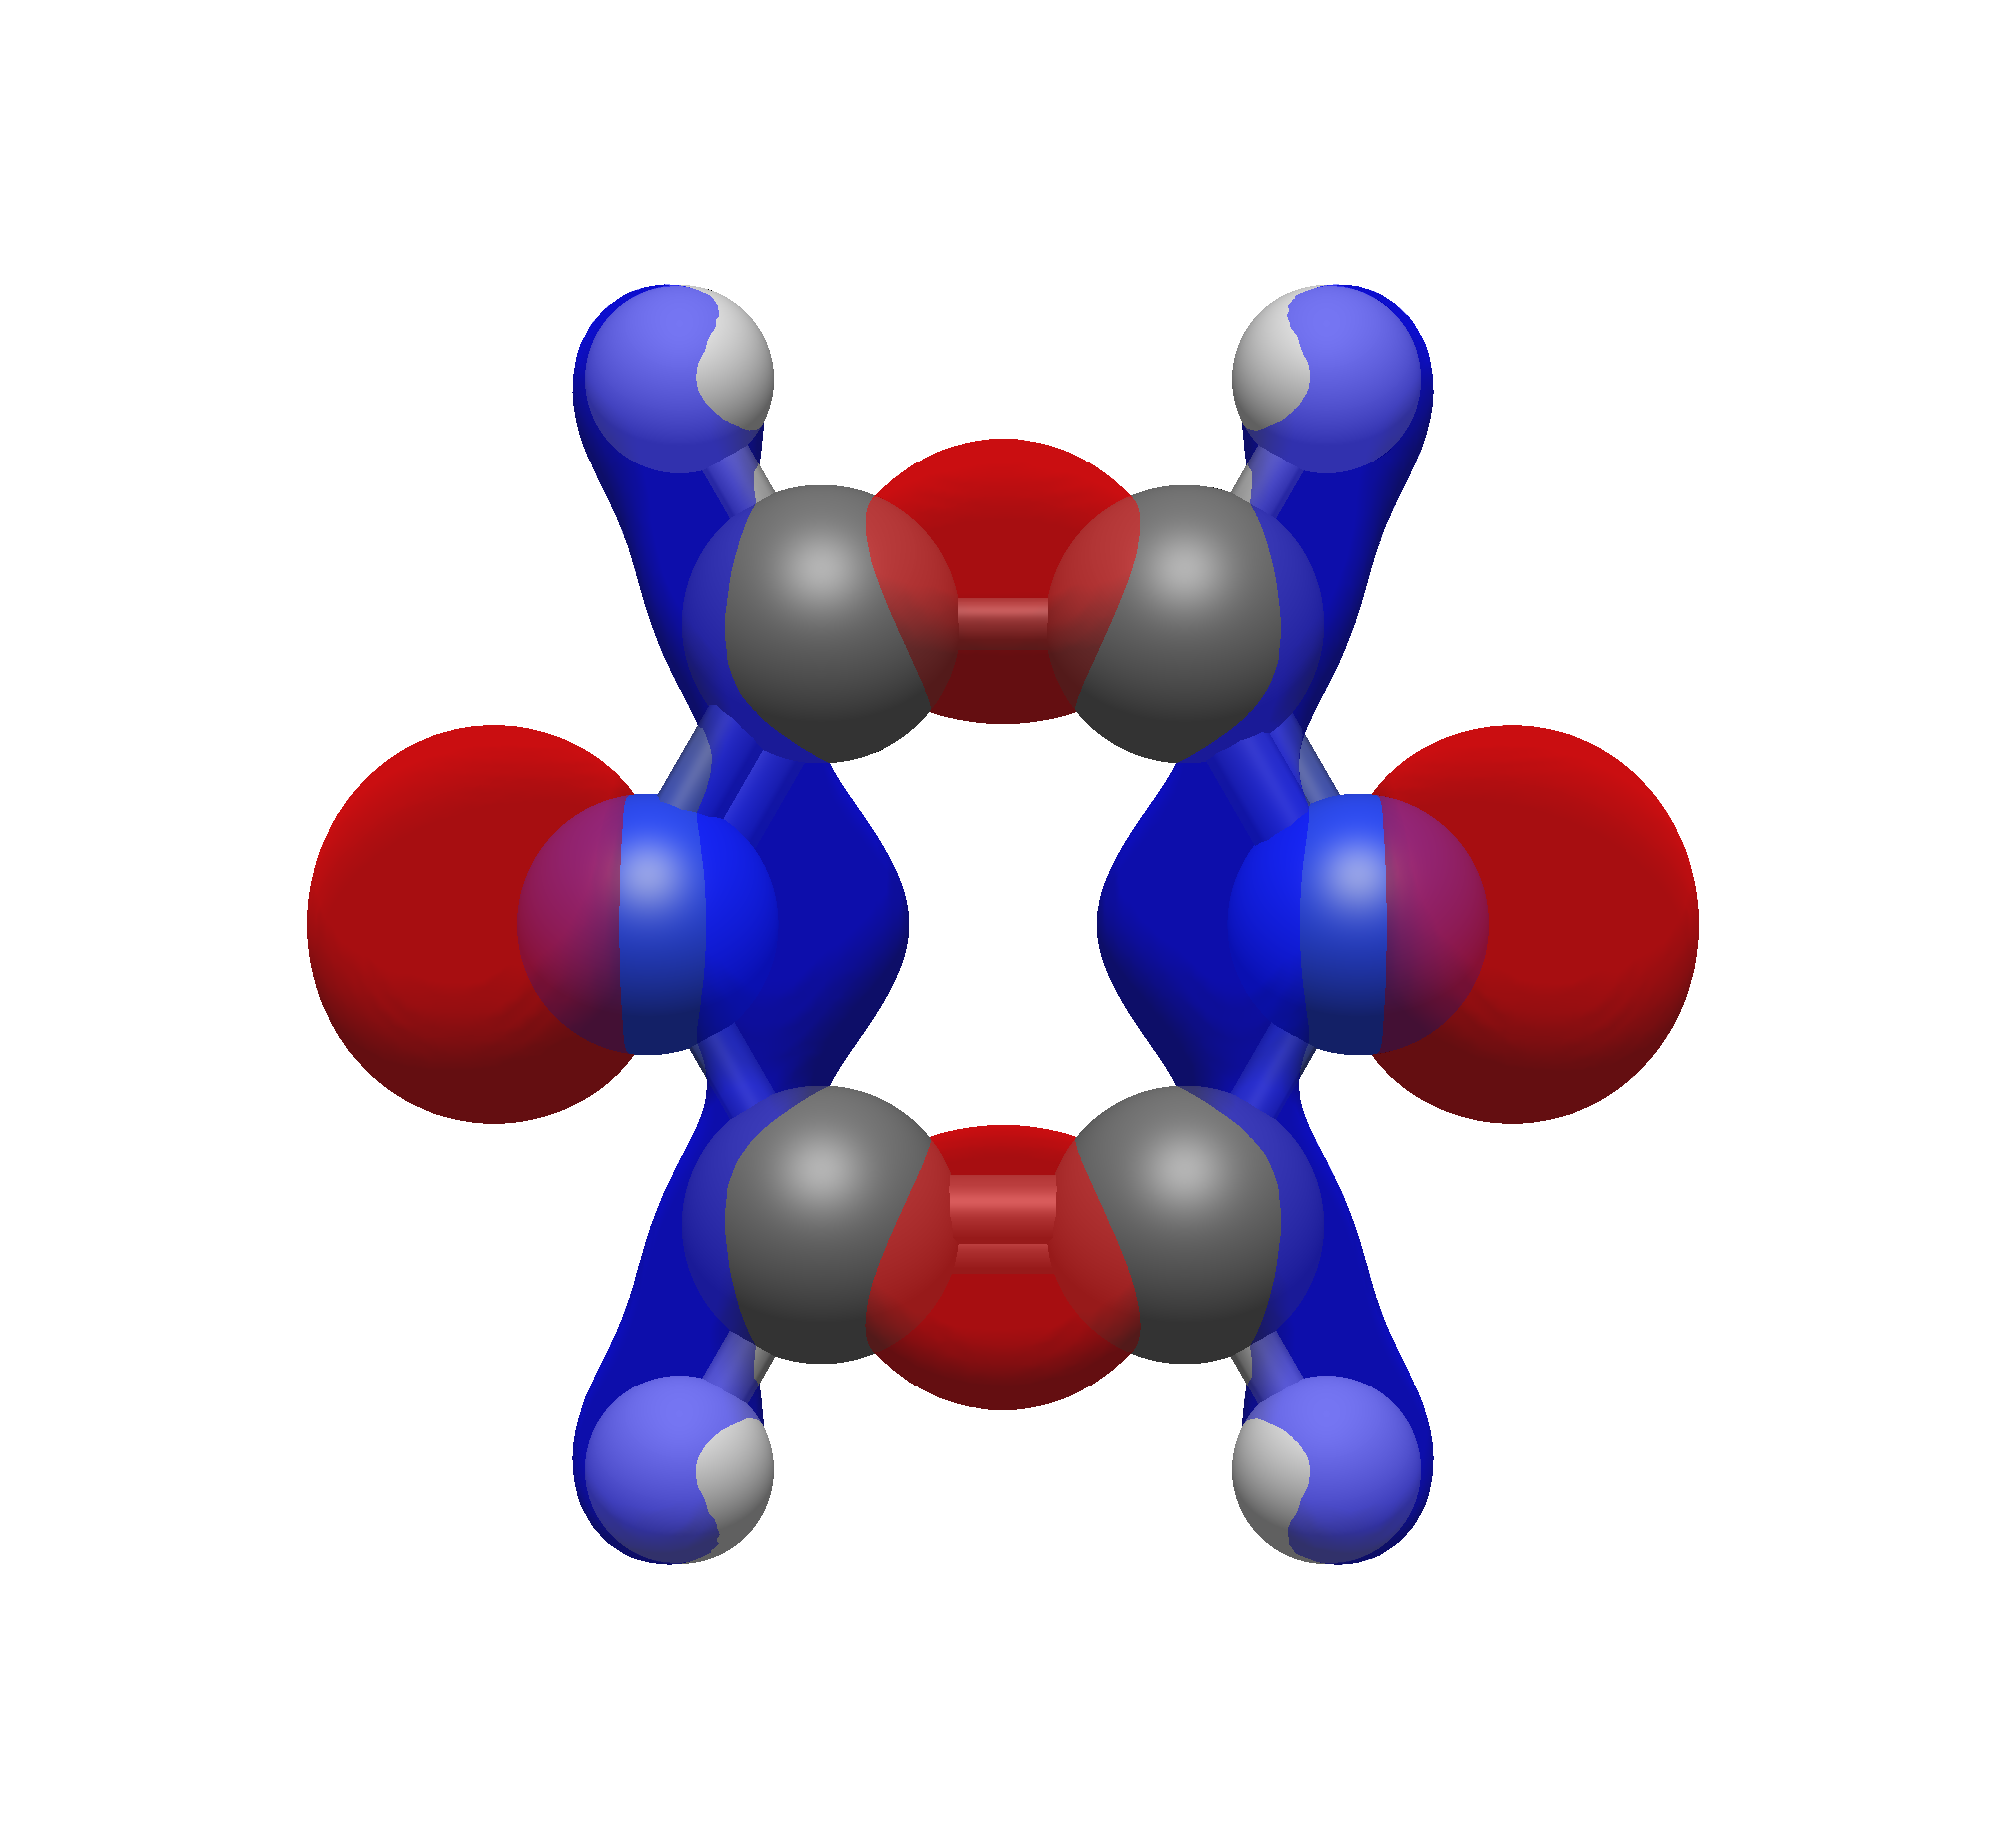
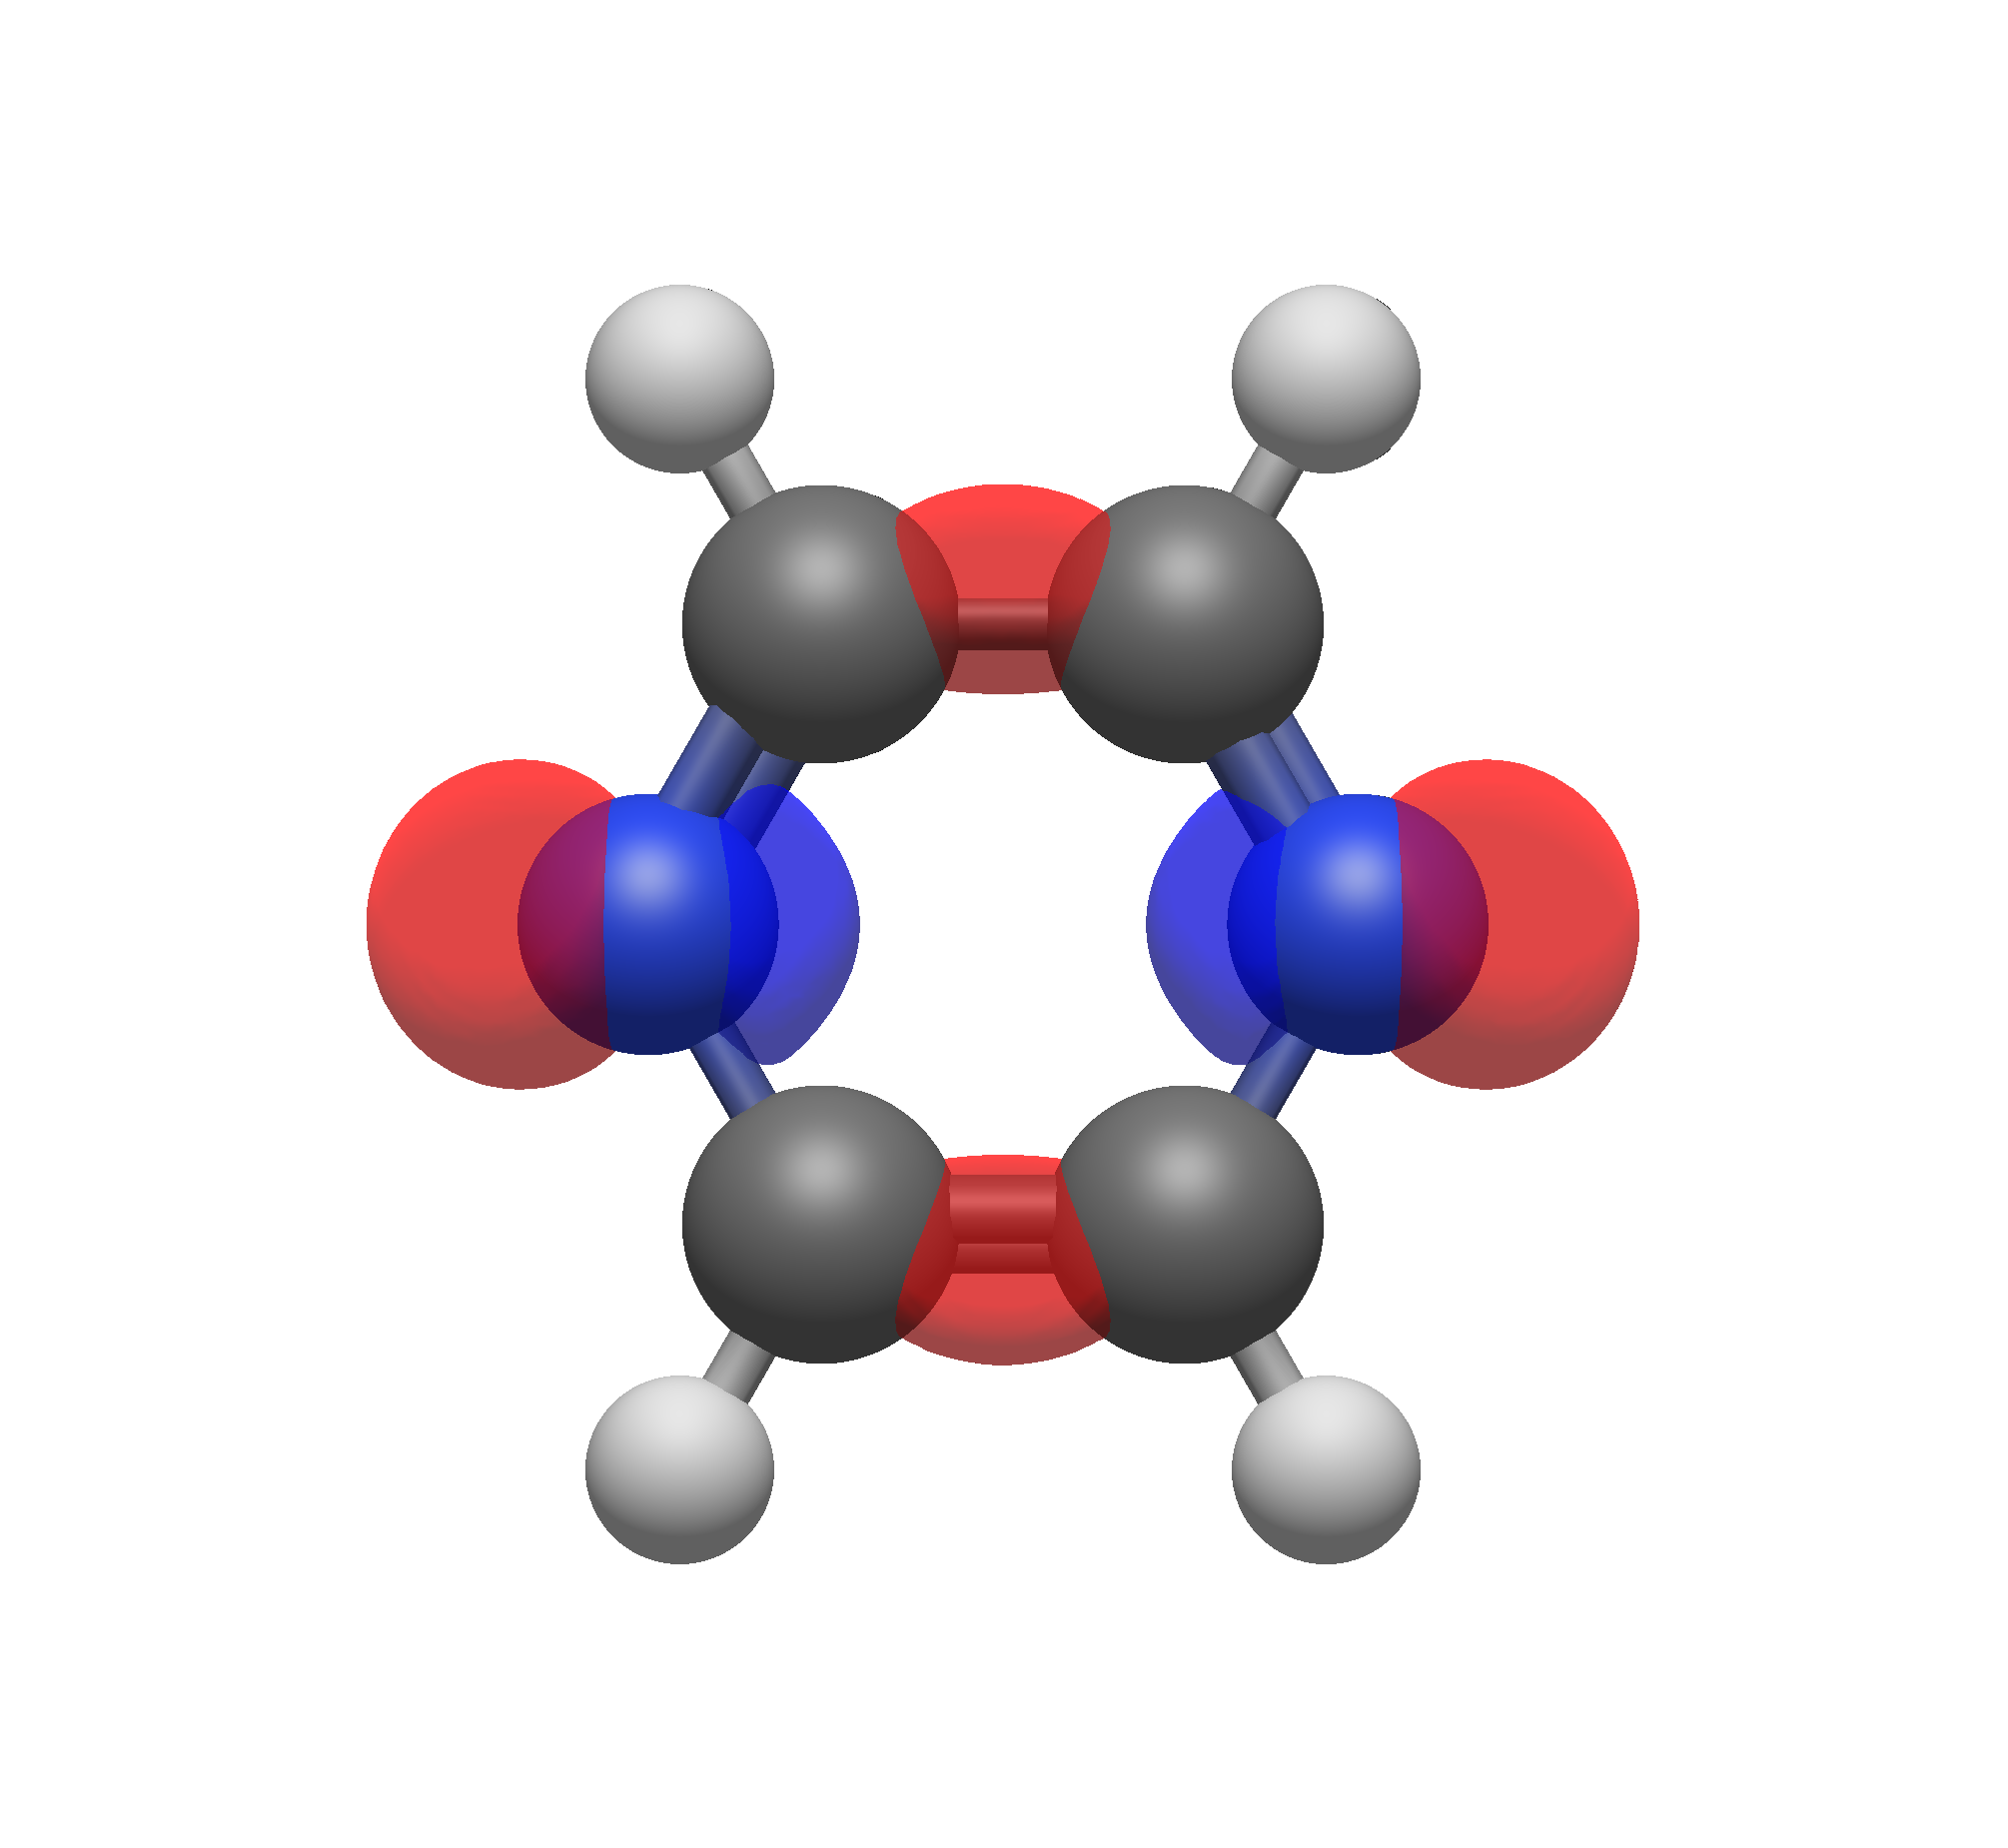
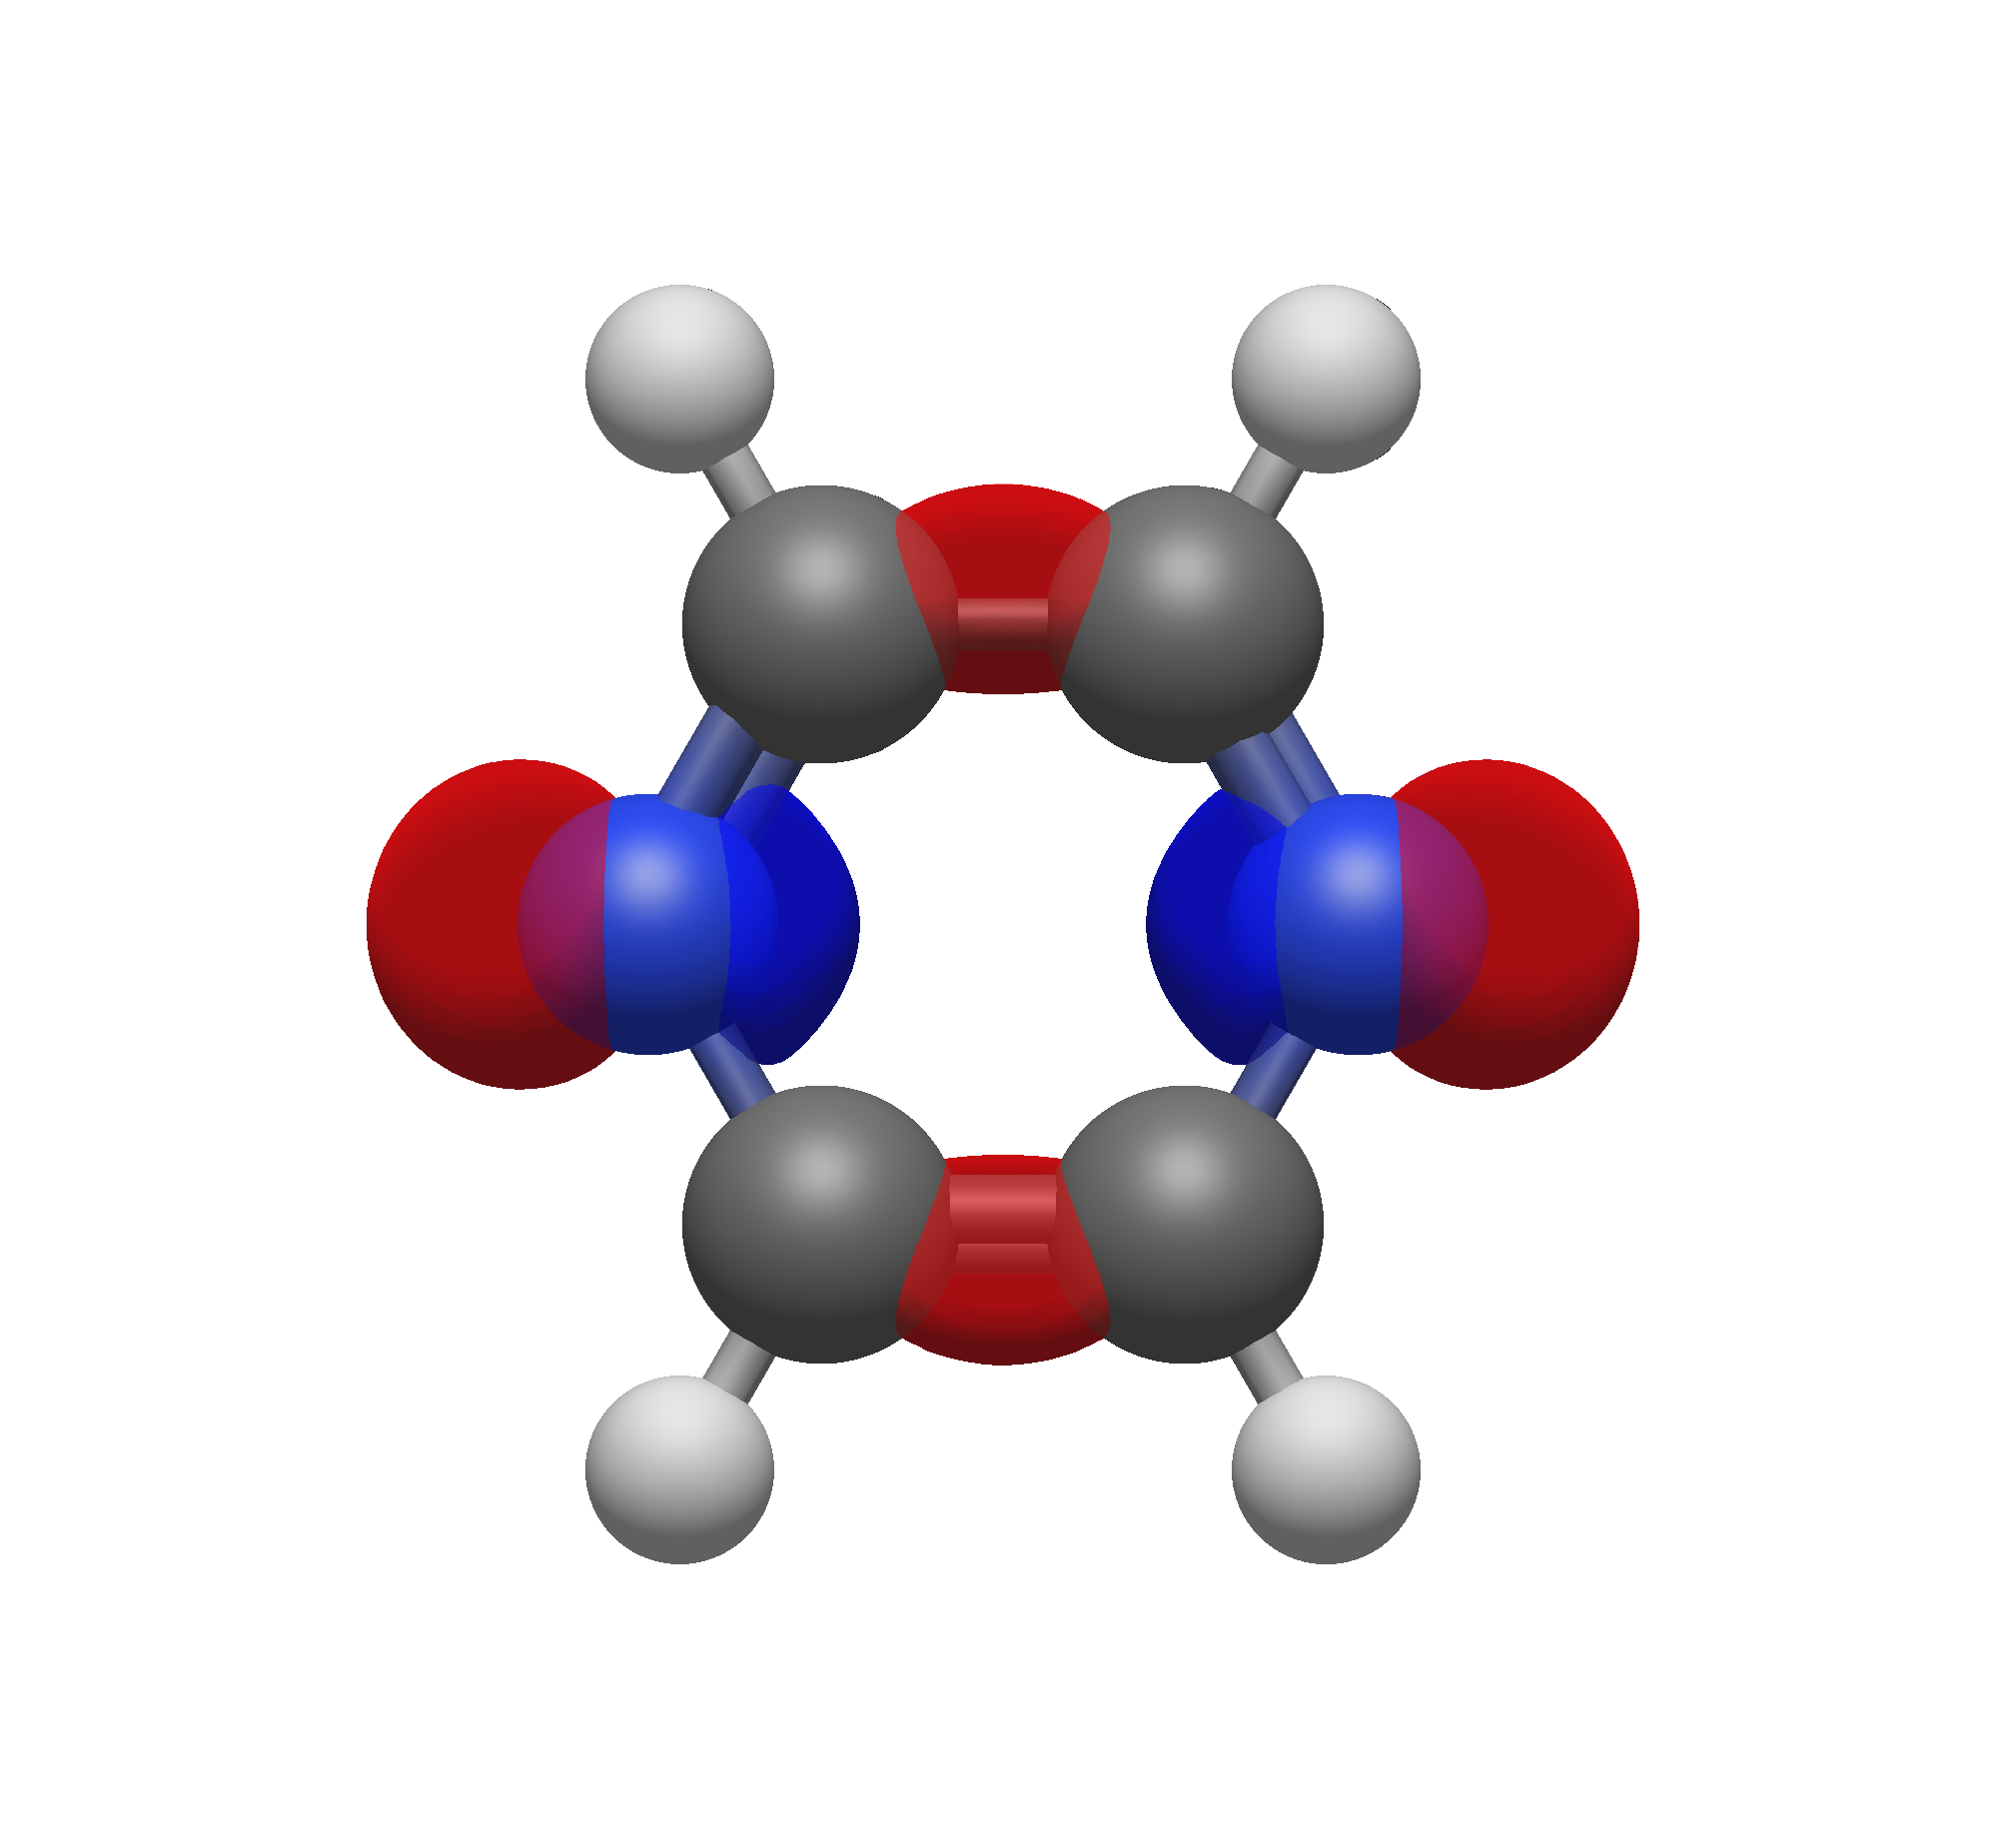
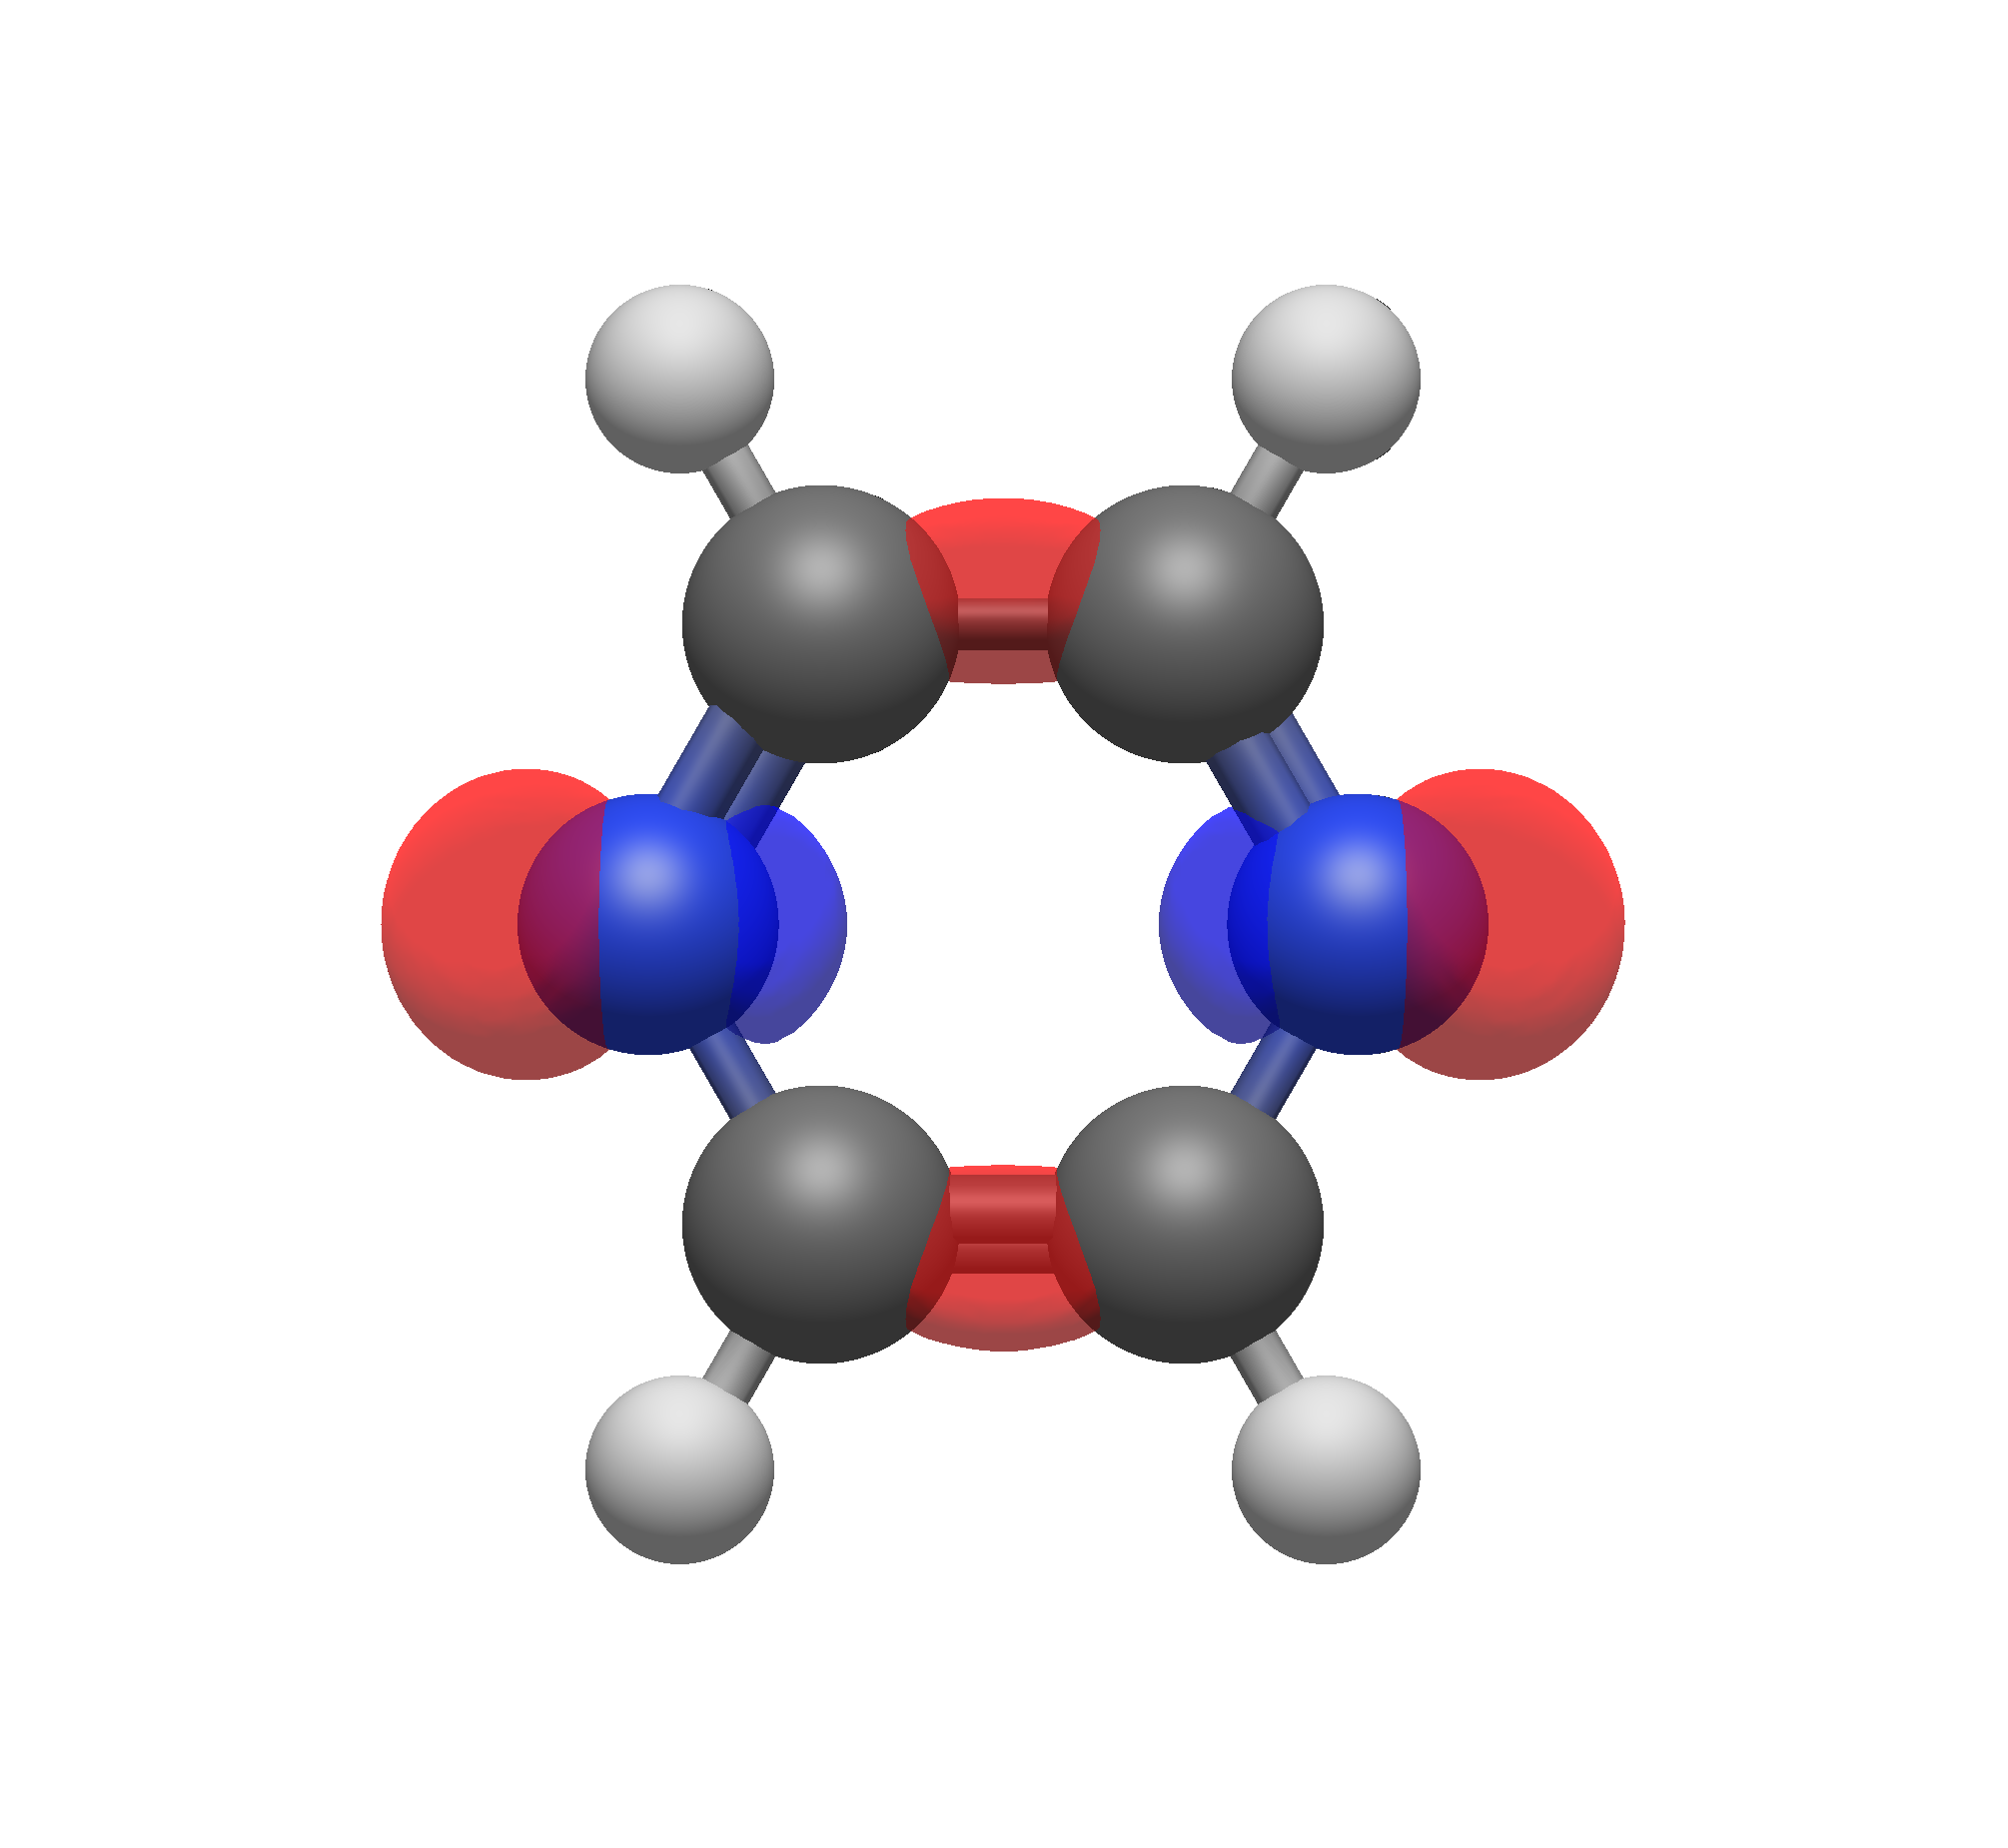
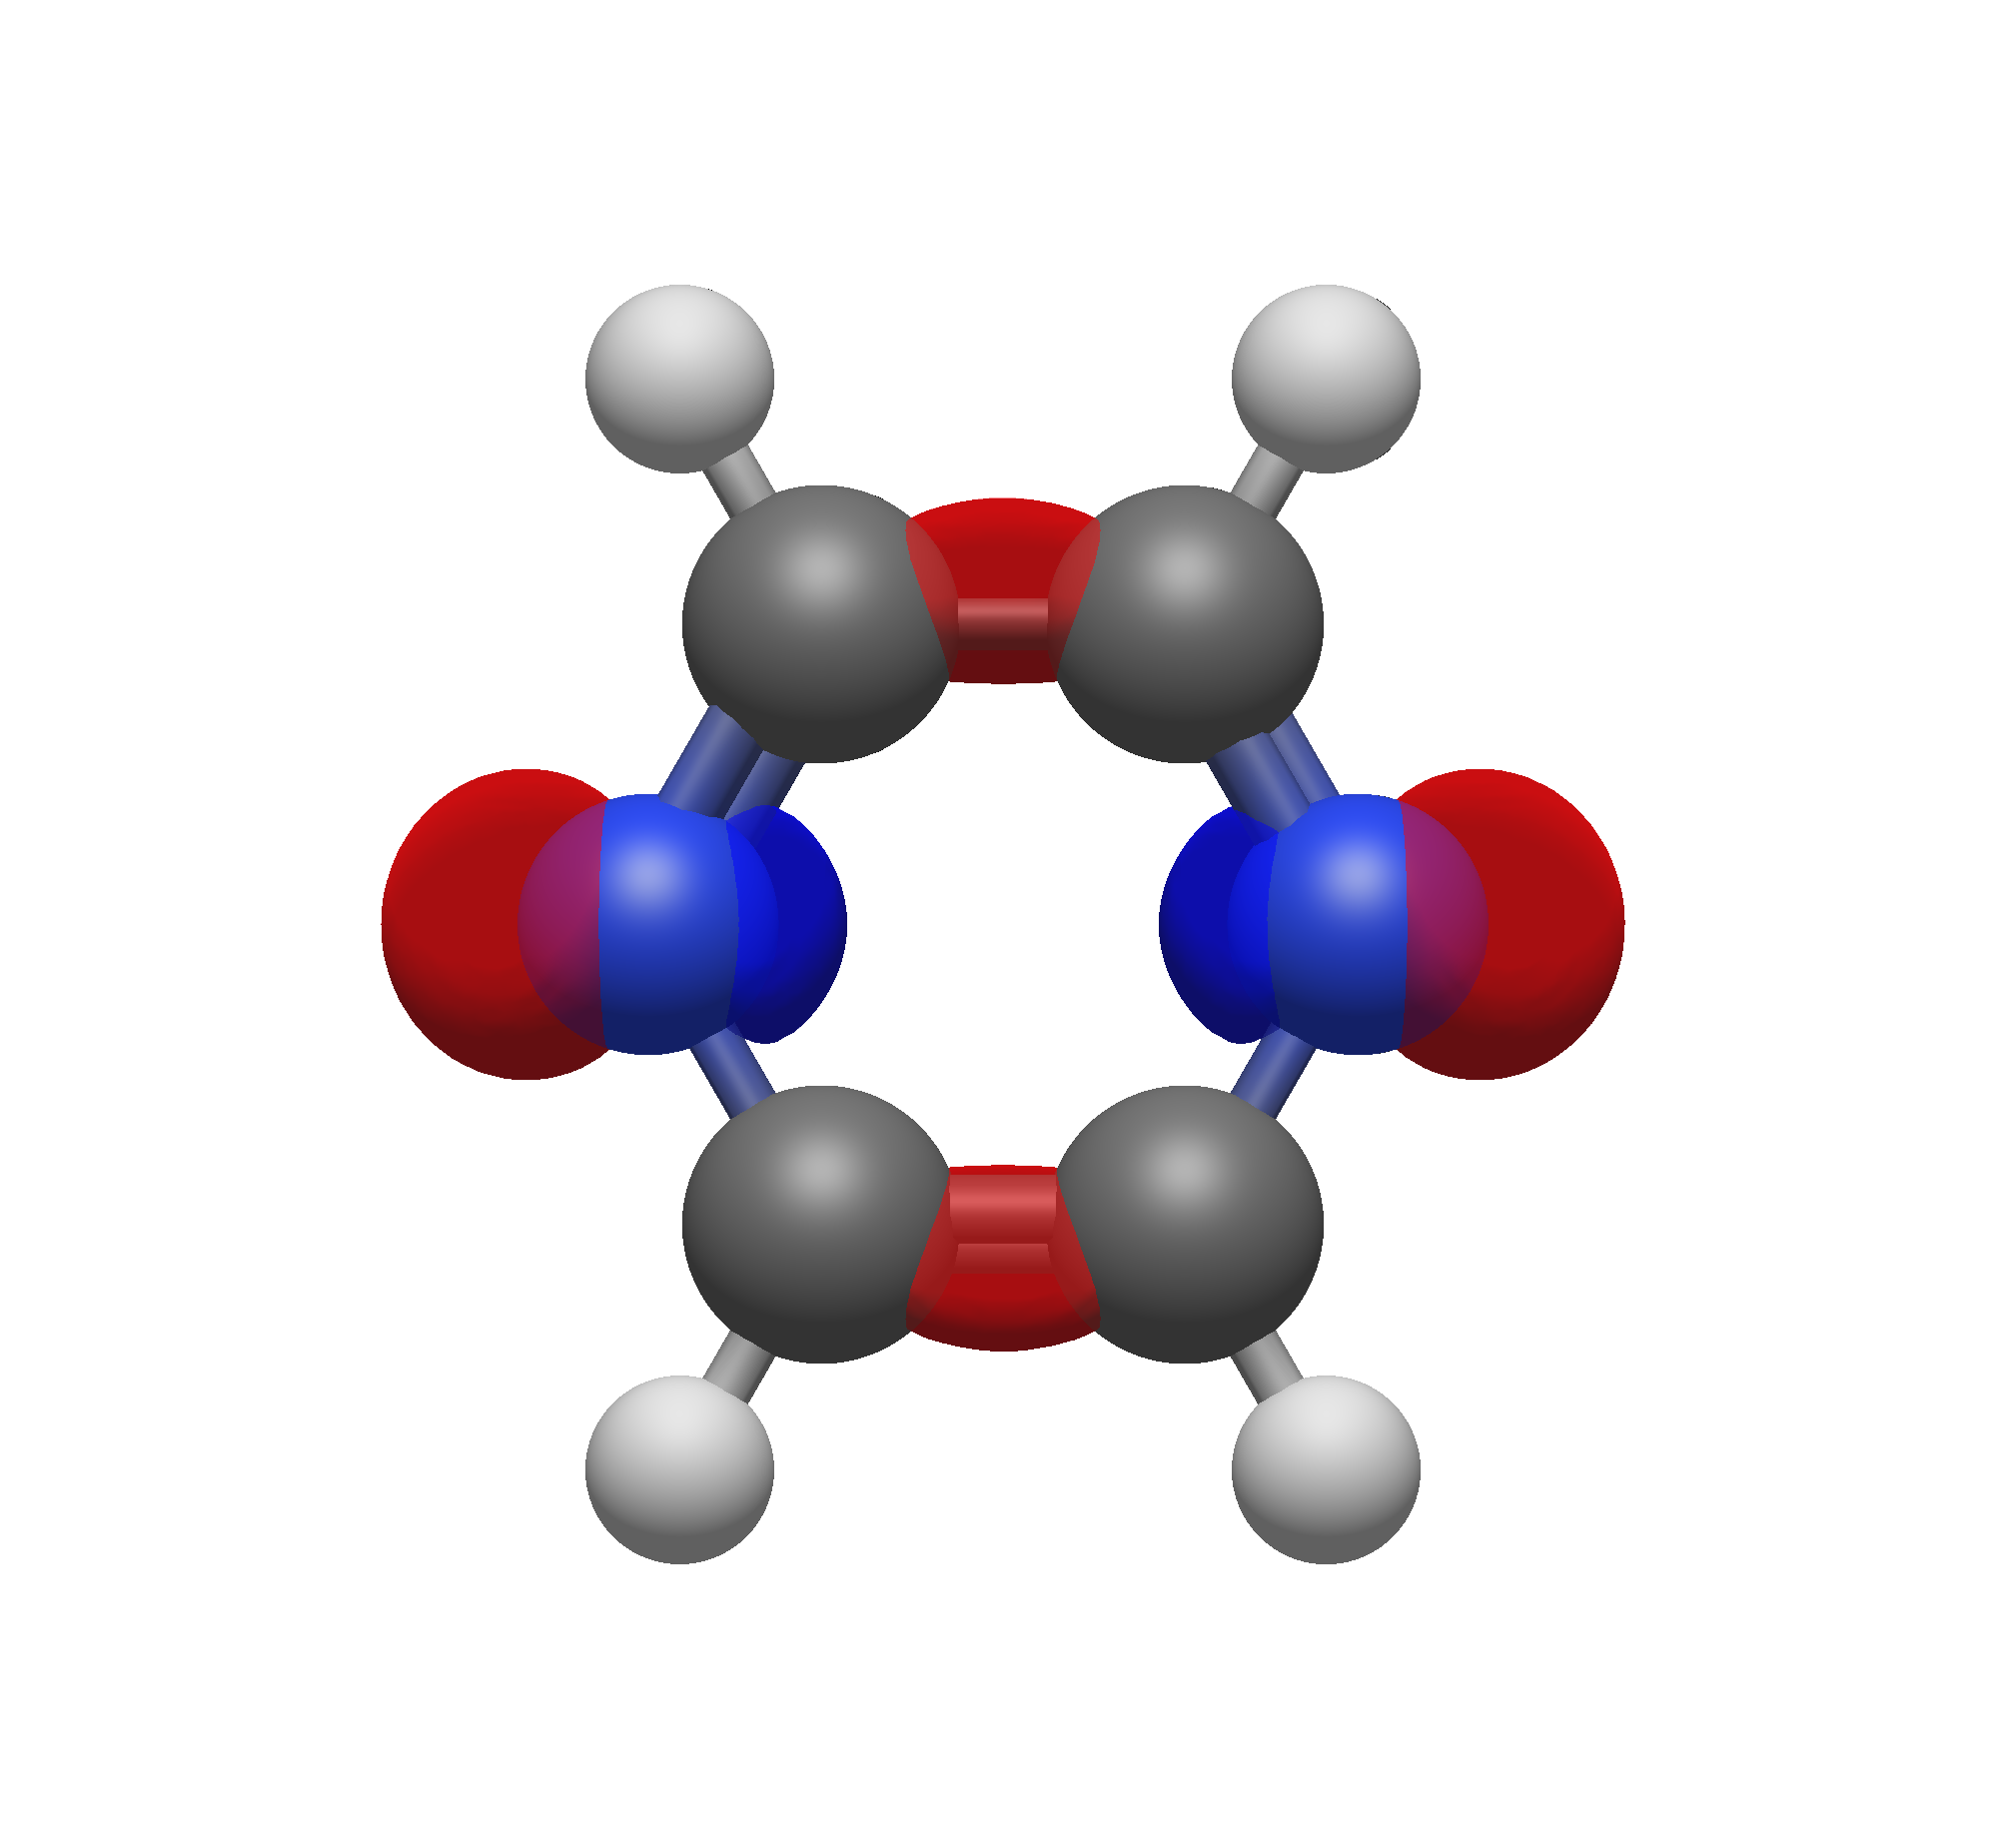
The Isosurface value determines the cutoff distance for the surface by dictating the lowest value of the volume scalars to display. There is not an accepted set of isosurface values that should be used in papers, however it is recommended to stick to 0.01–0.10, and it is strongly encouraged to report your isosurface values if you include a surface in a figure.
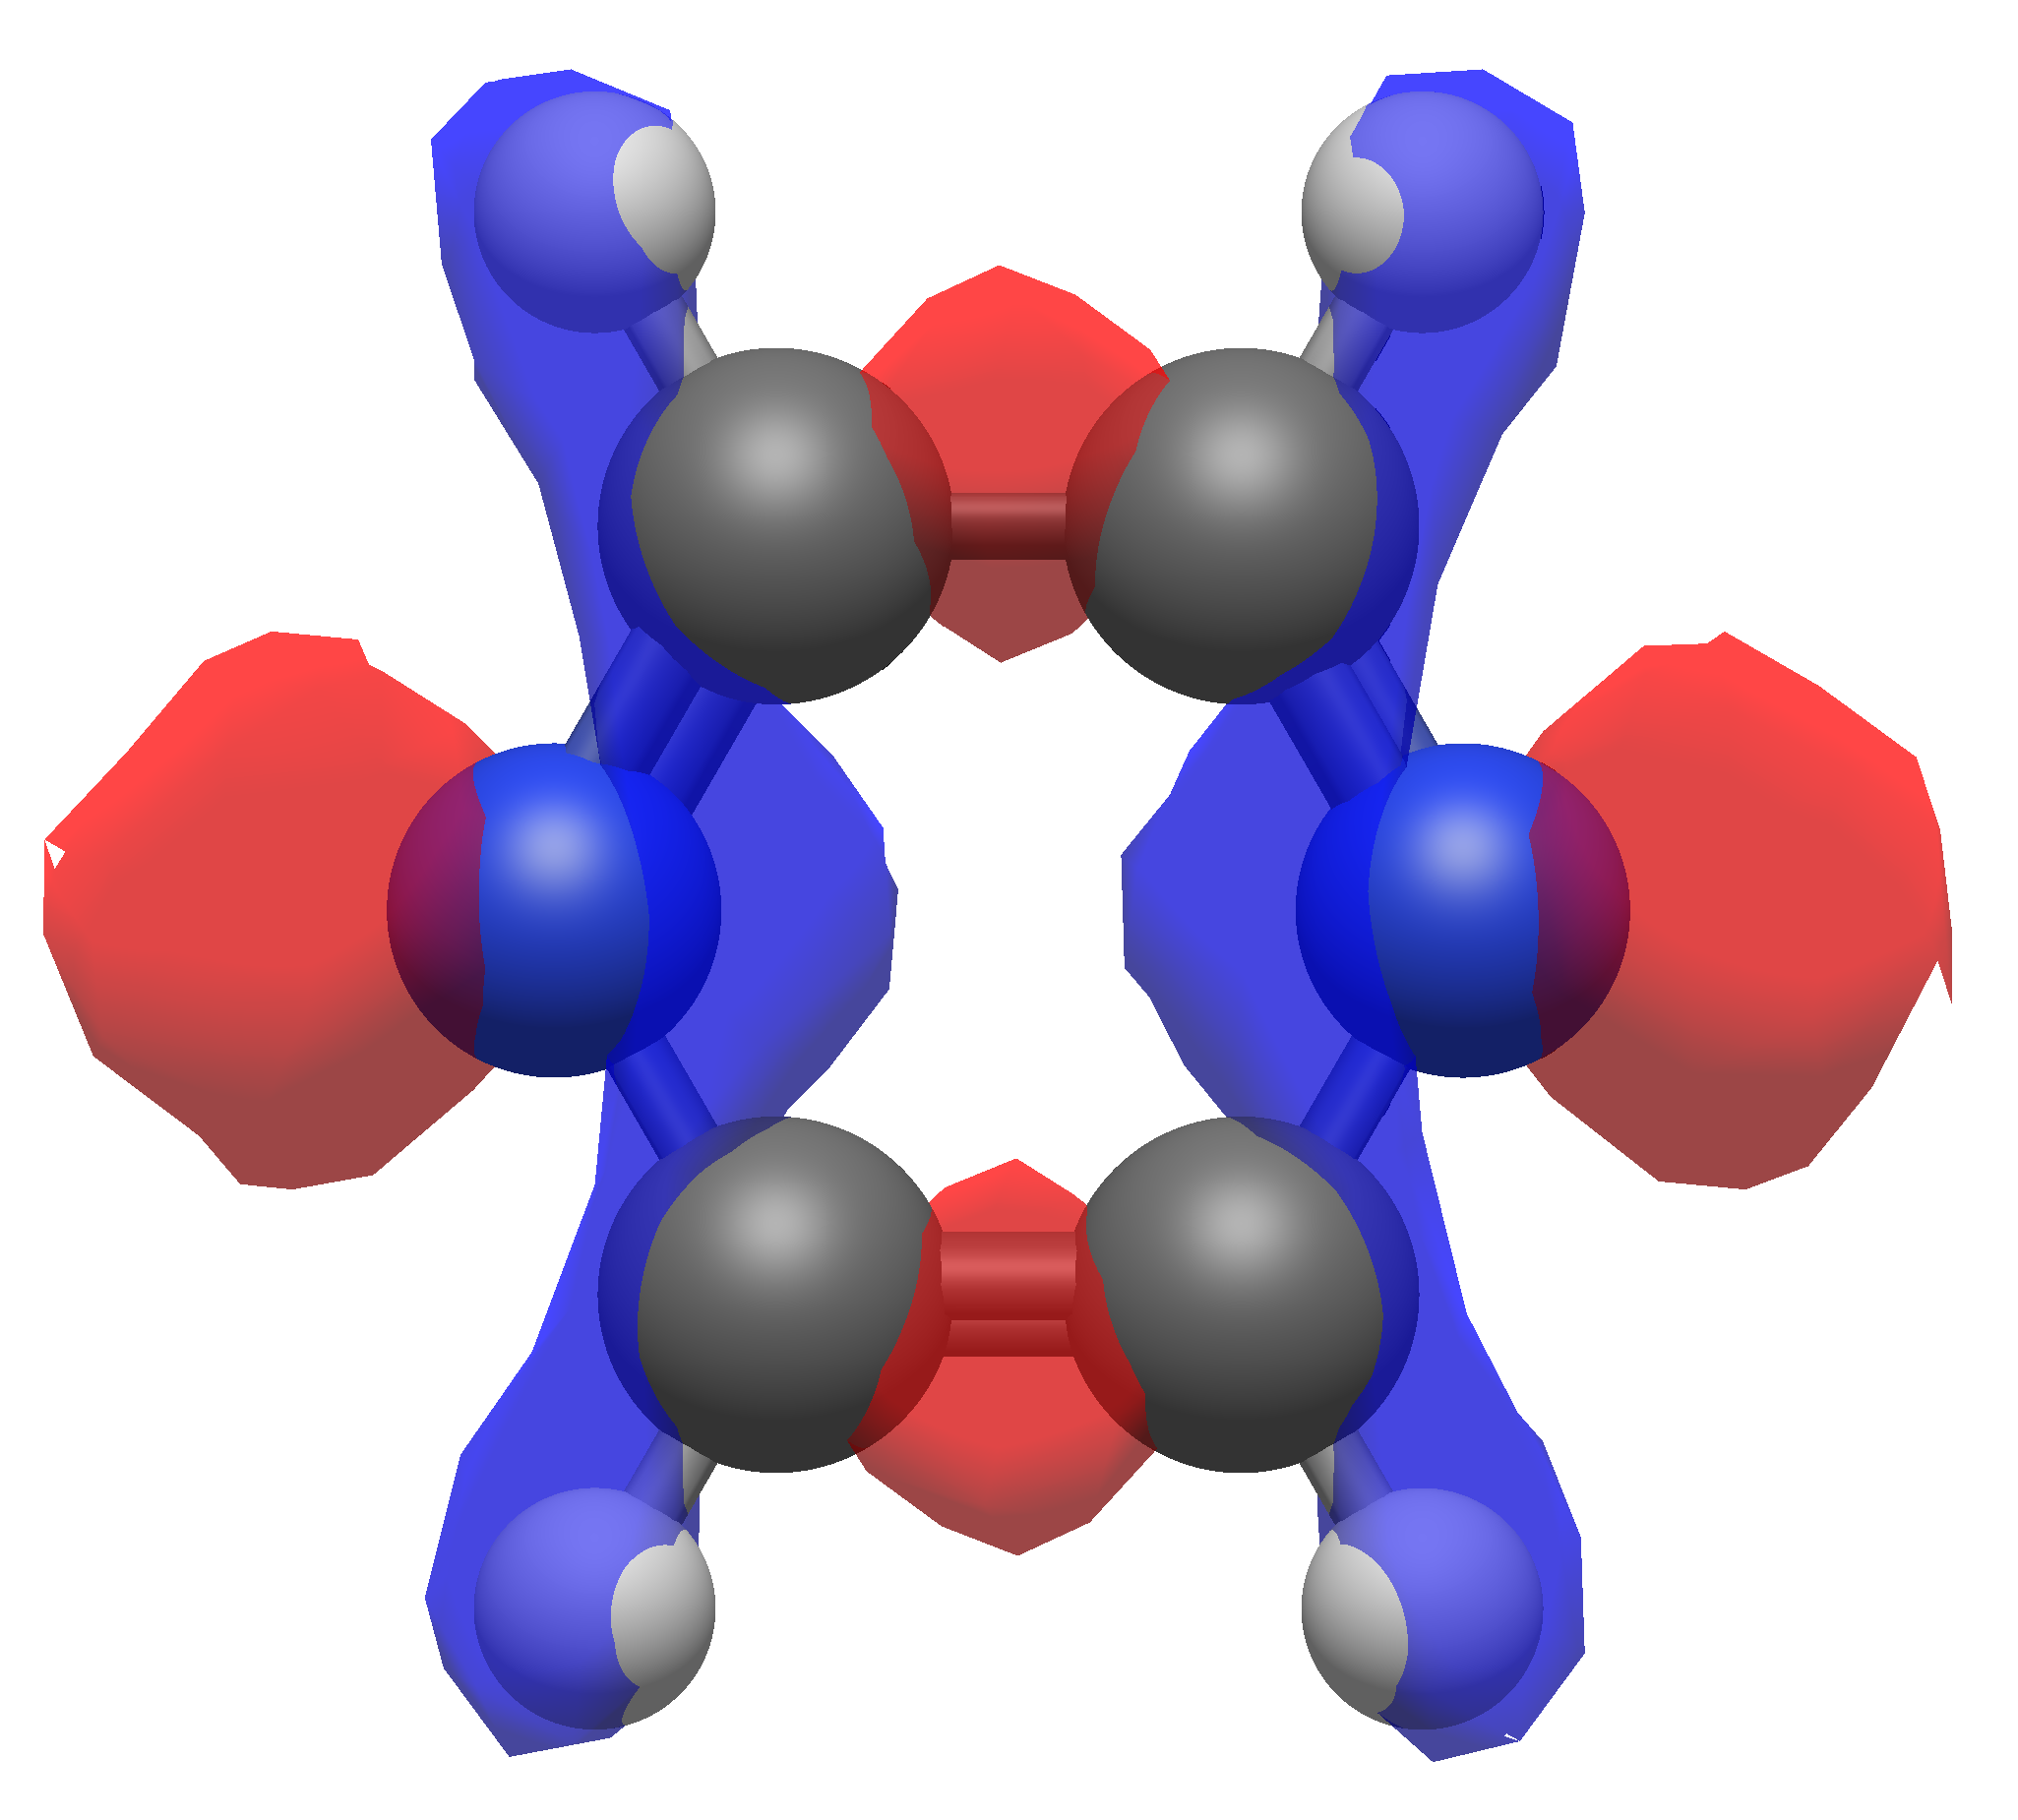
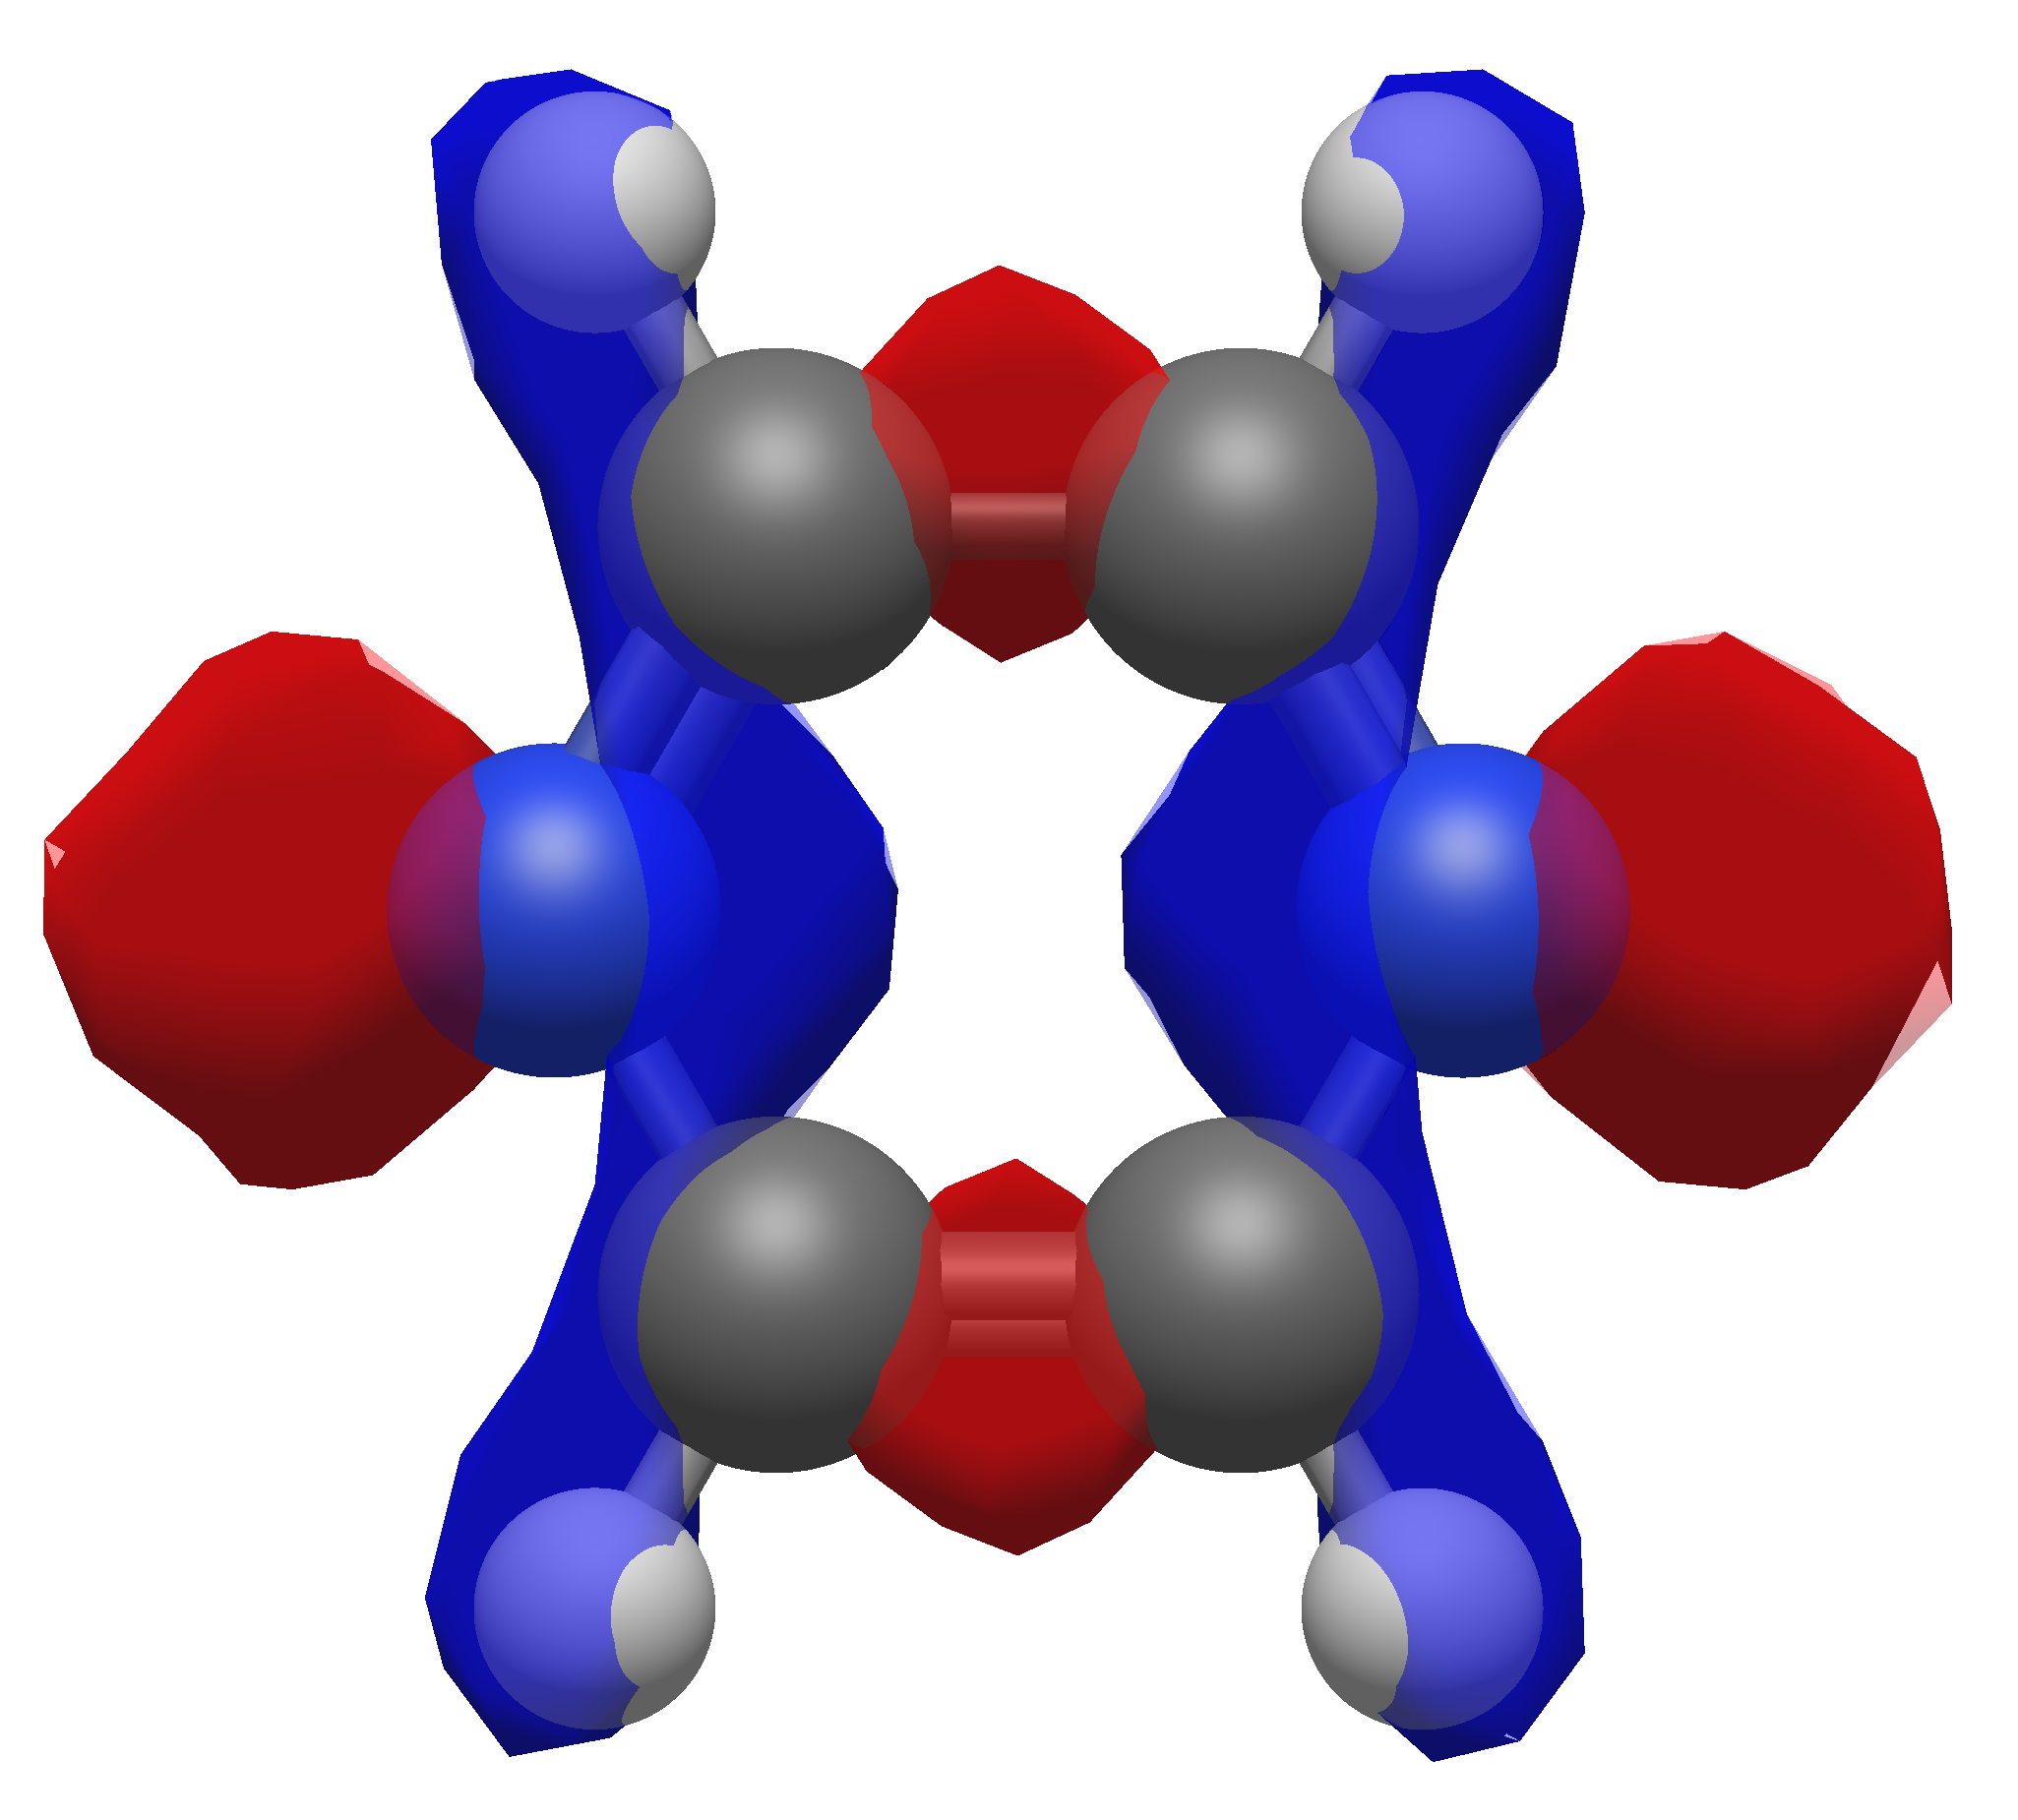
The reason for this becomes evident with the figure below, which shows the HOMO of pyrazine at 10 different isosurface values. As you move through the different values, you’ll see that the orbital overlap between atoms can change drastically as a function of the chosen isosurface value. At 0.01, you might be tempted to say the nitrogens on opposite ends of the pyrazine have bonding character right through the middle of the molecule, but as we know, this is not the case. Only once the isosurface value reaches ~0.08 do we see that in fact the nature of the HOMO is more likely a pair of \(\sigma_b\) orbitals between the carbon atoms and two lone pairs on the nitrogen atoms.
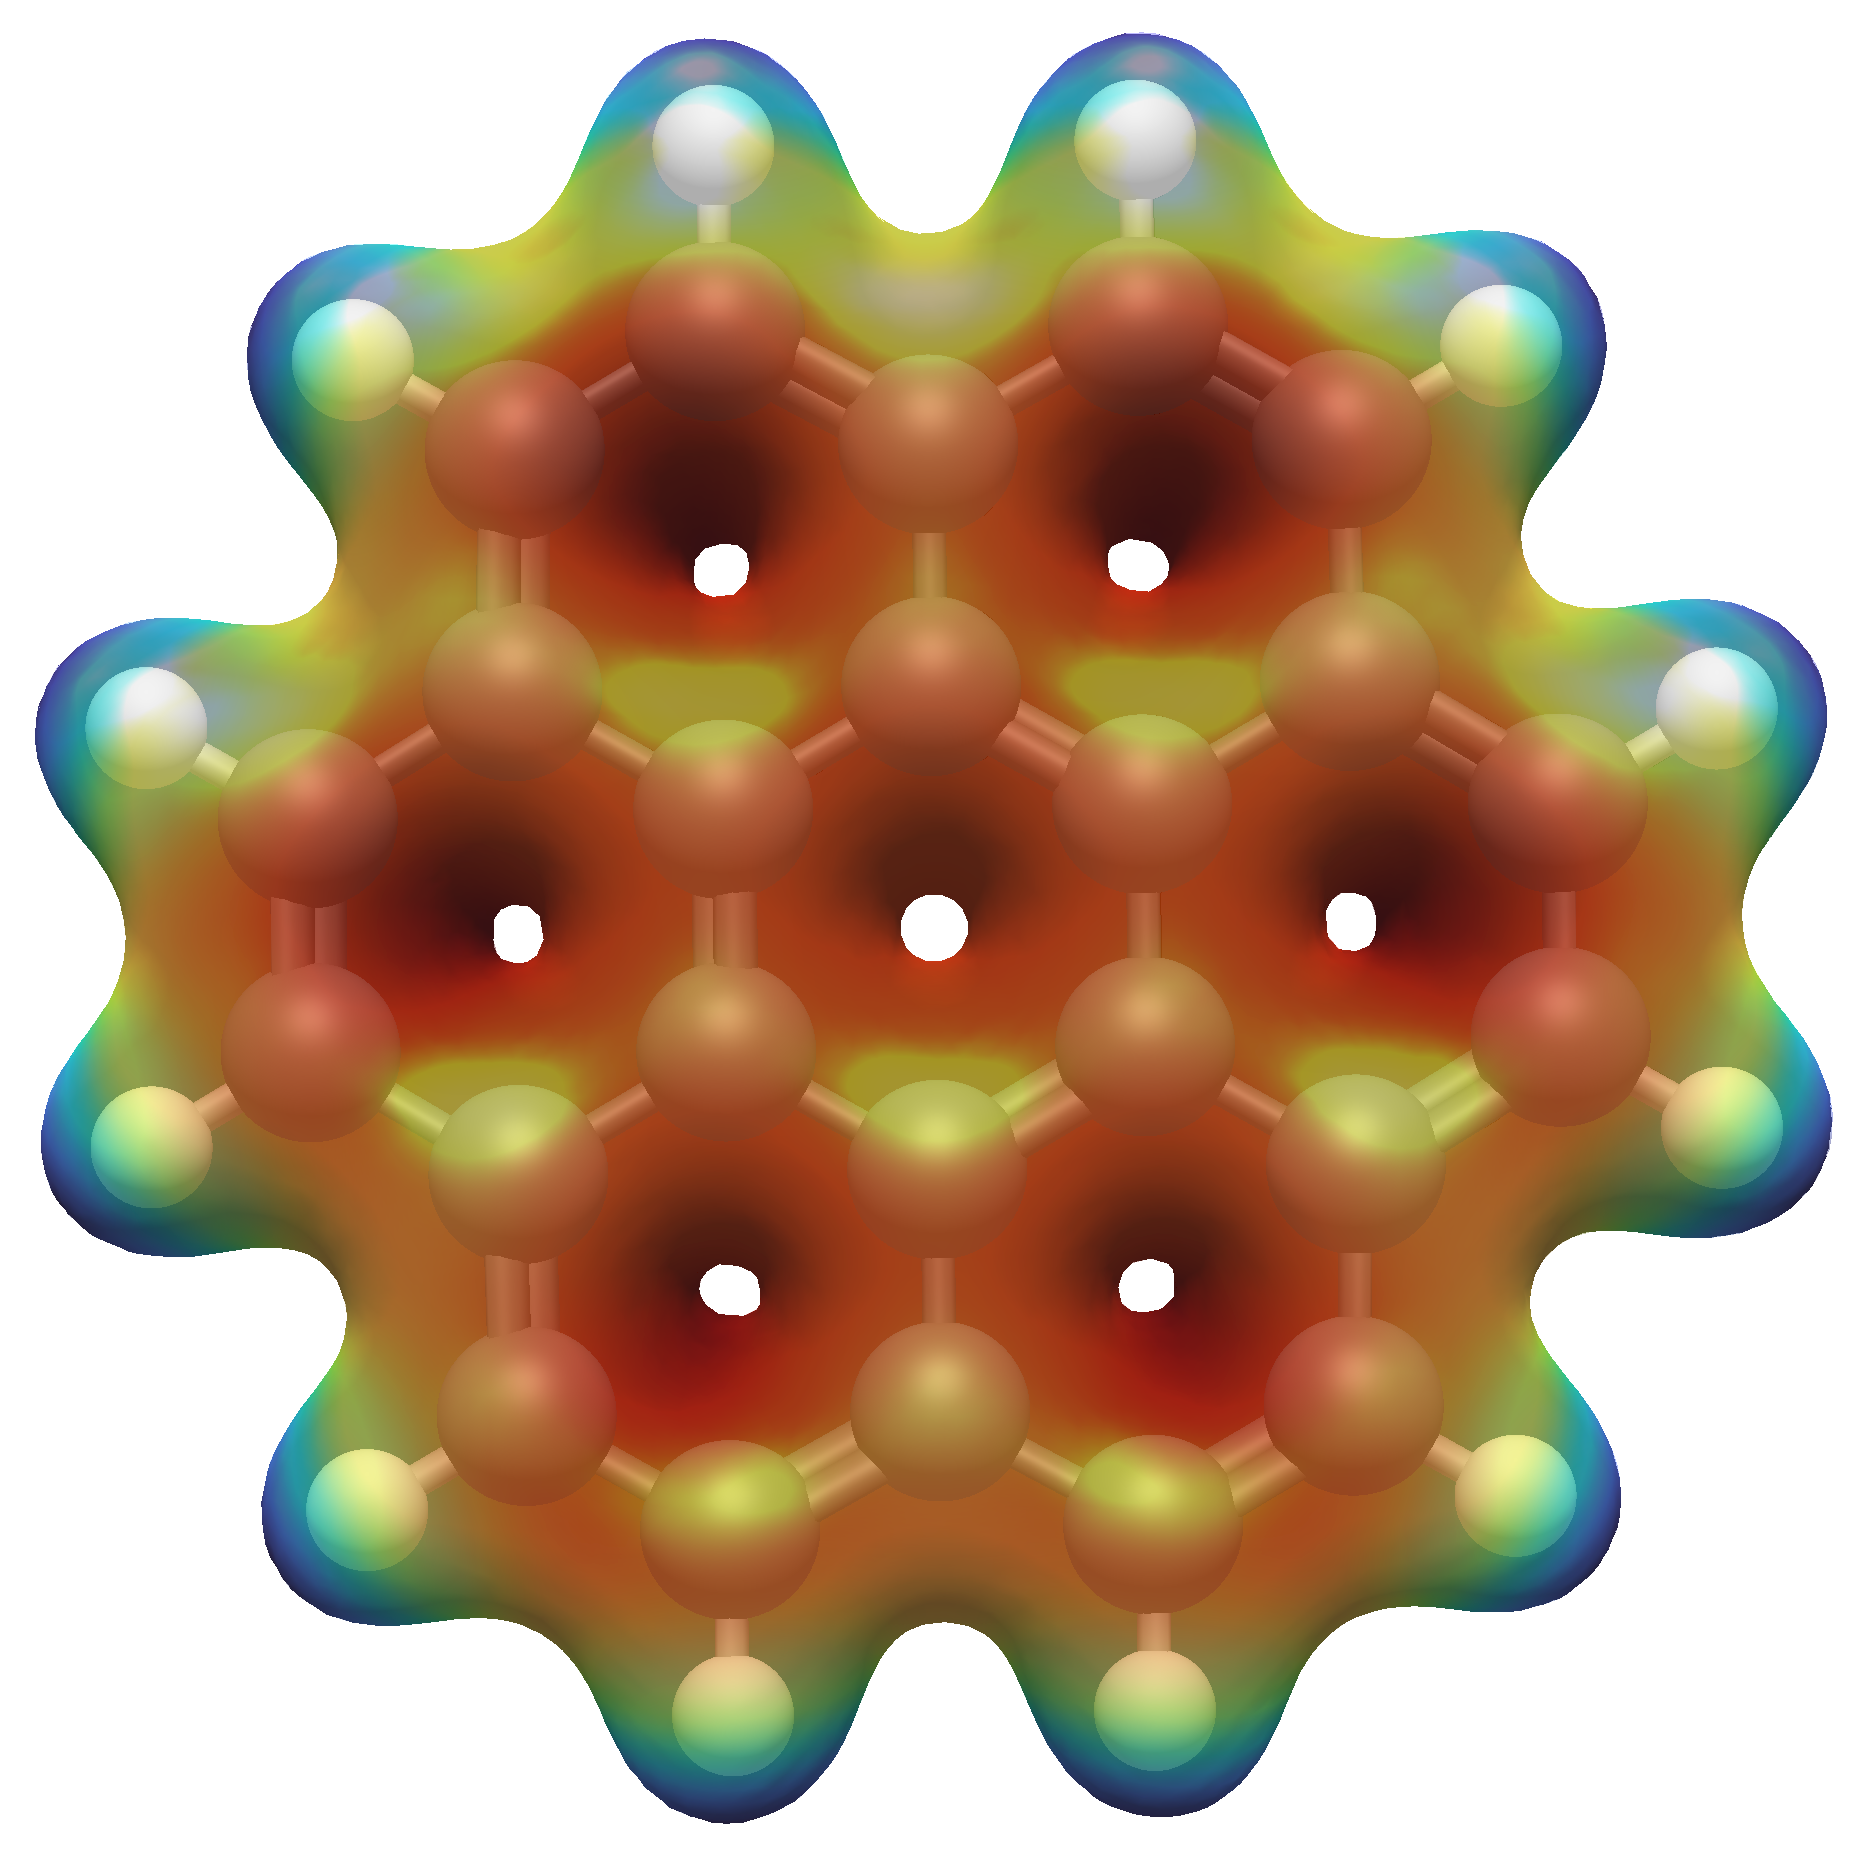
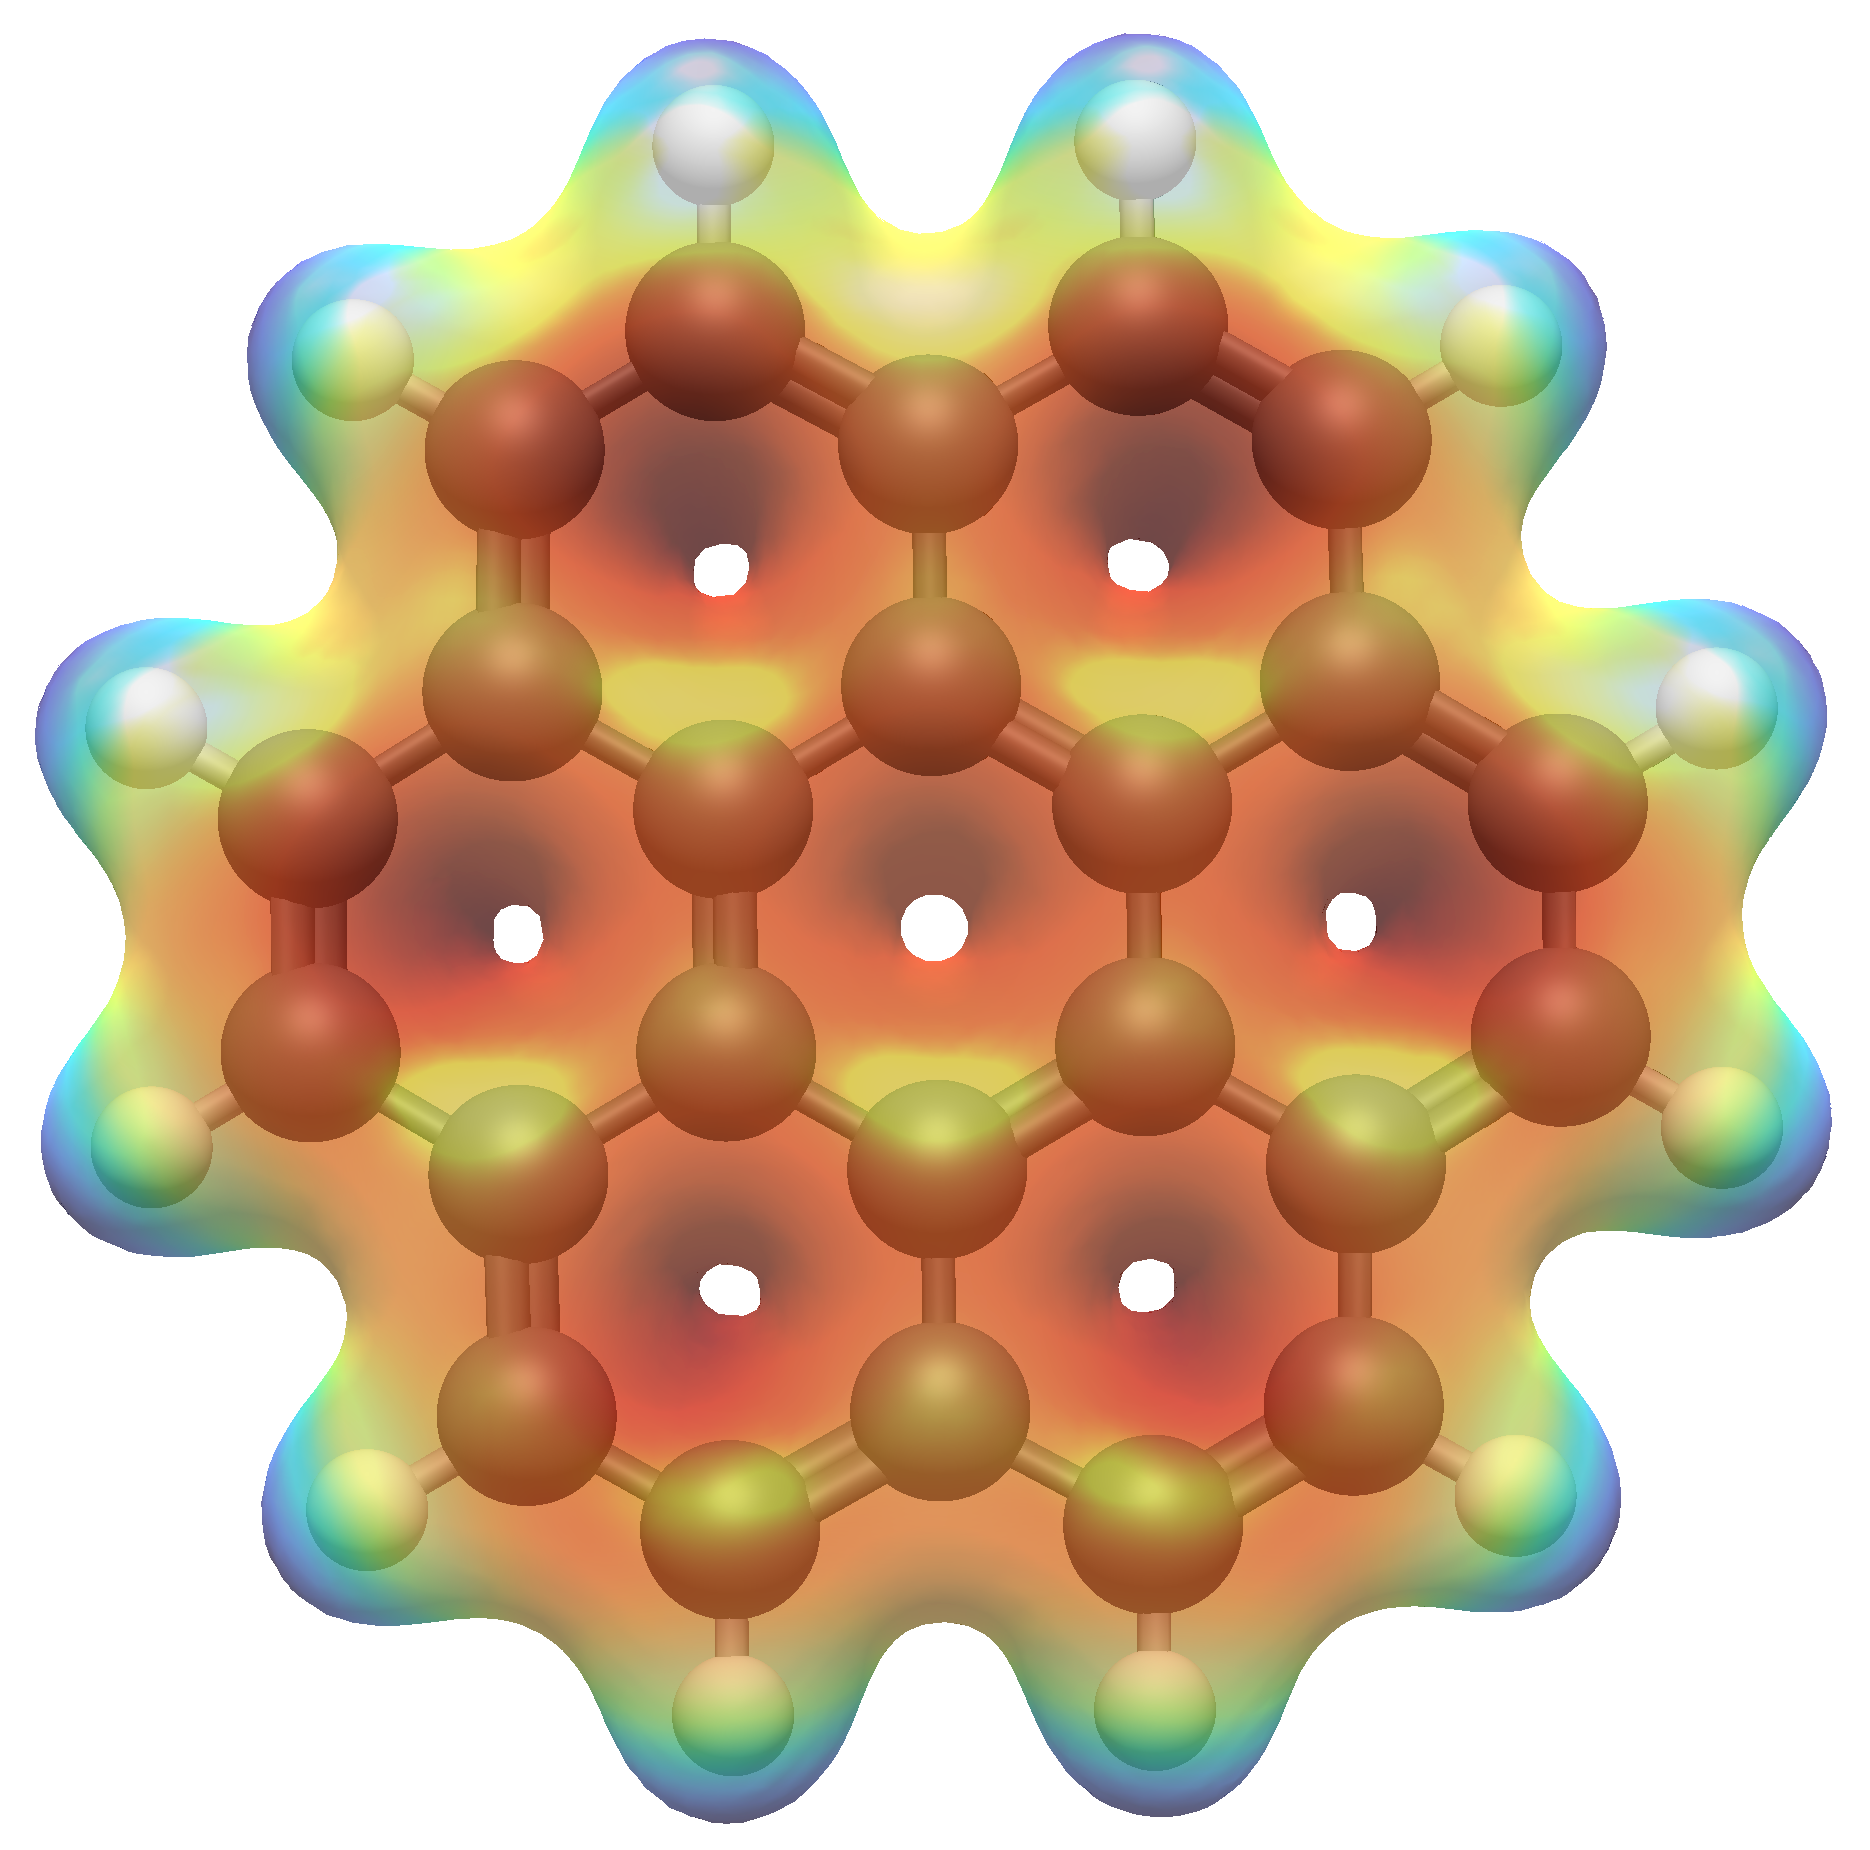
It should be noted, however, that while one may initially conclude that all orbitals should be shown with an isosurface value of ~0.08, this is not the case. The isosurface value is not universal across varying system sizes, which can be seen simply by examining the HOMO of coronene below. At 0.08 there is essentially zero bonding character shown at all, when we know that the HOMO of coronene should be a \(\pi\)-bonding network. It could be suggested that the correct isosurface value in this case is between 0.03 and 0.04, which both show the bonding nature of the HOMO quite well.
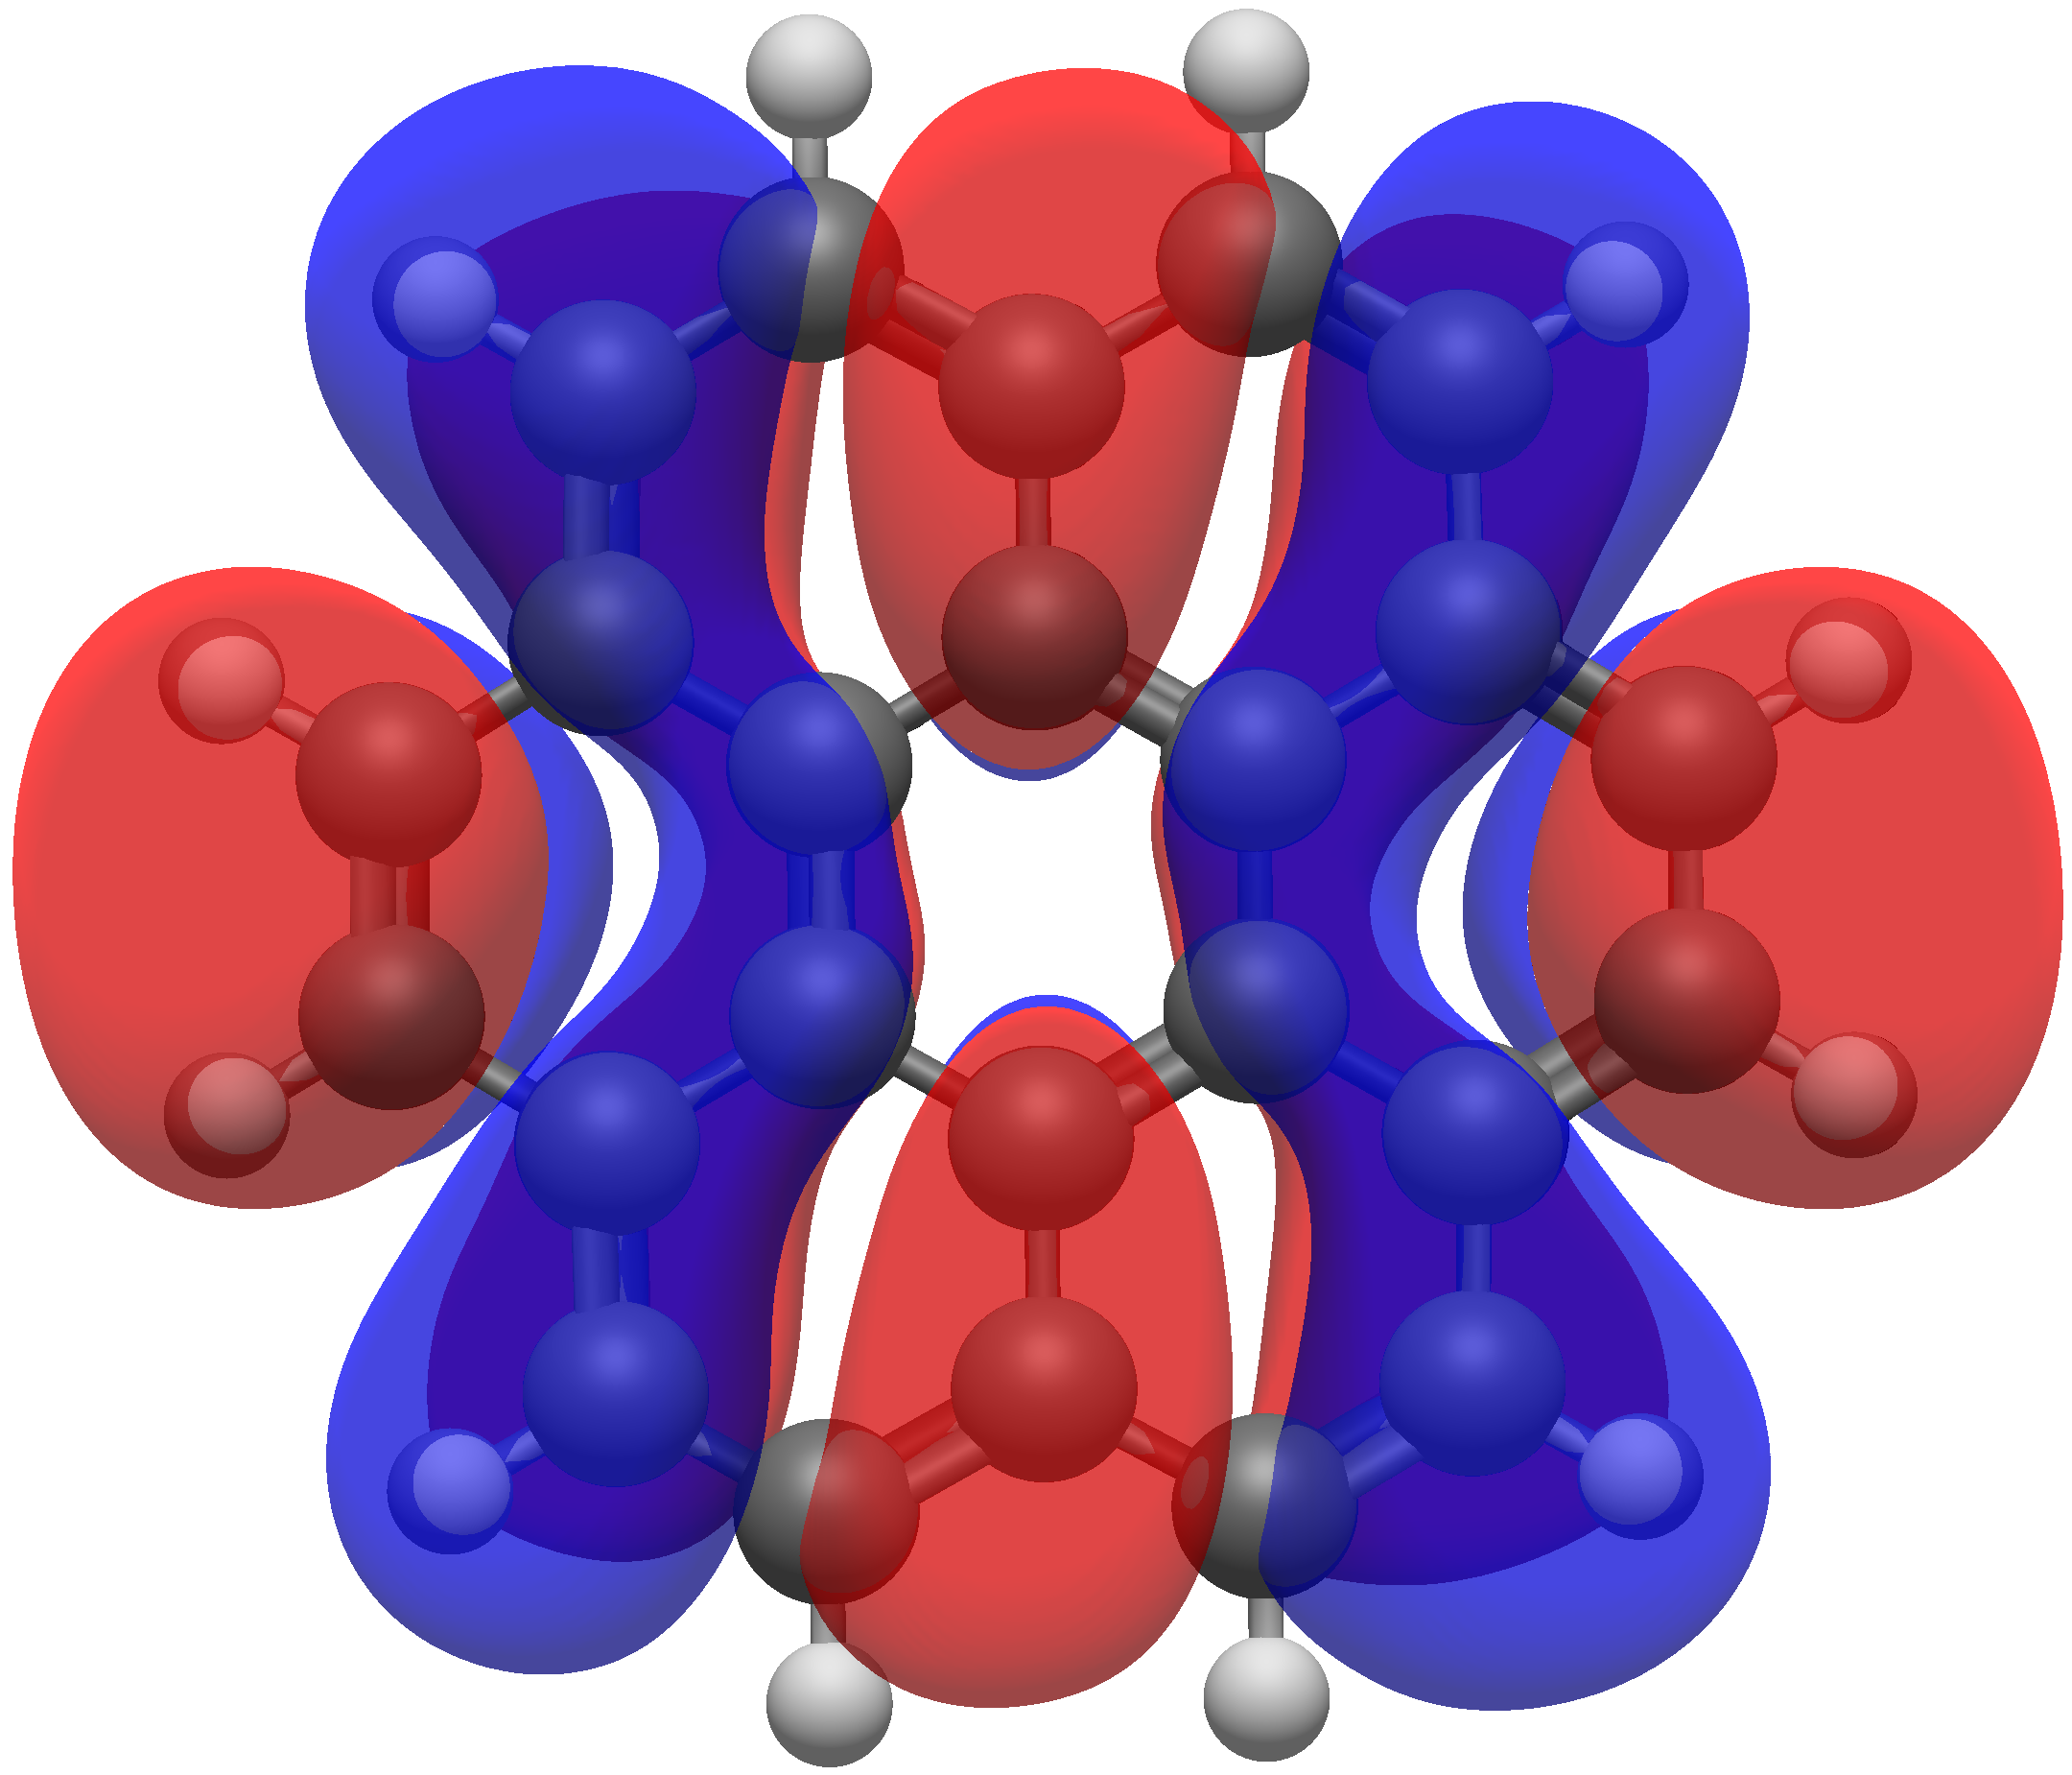
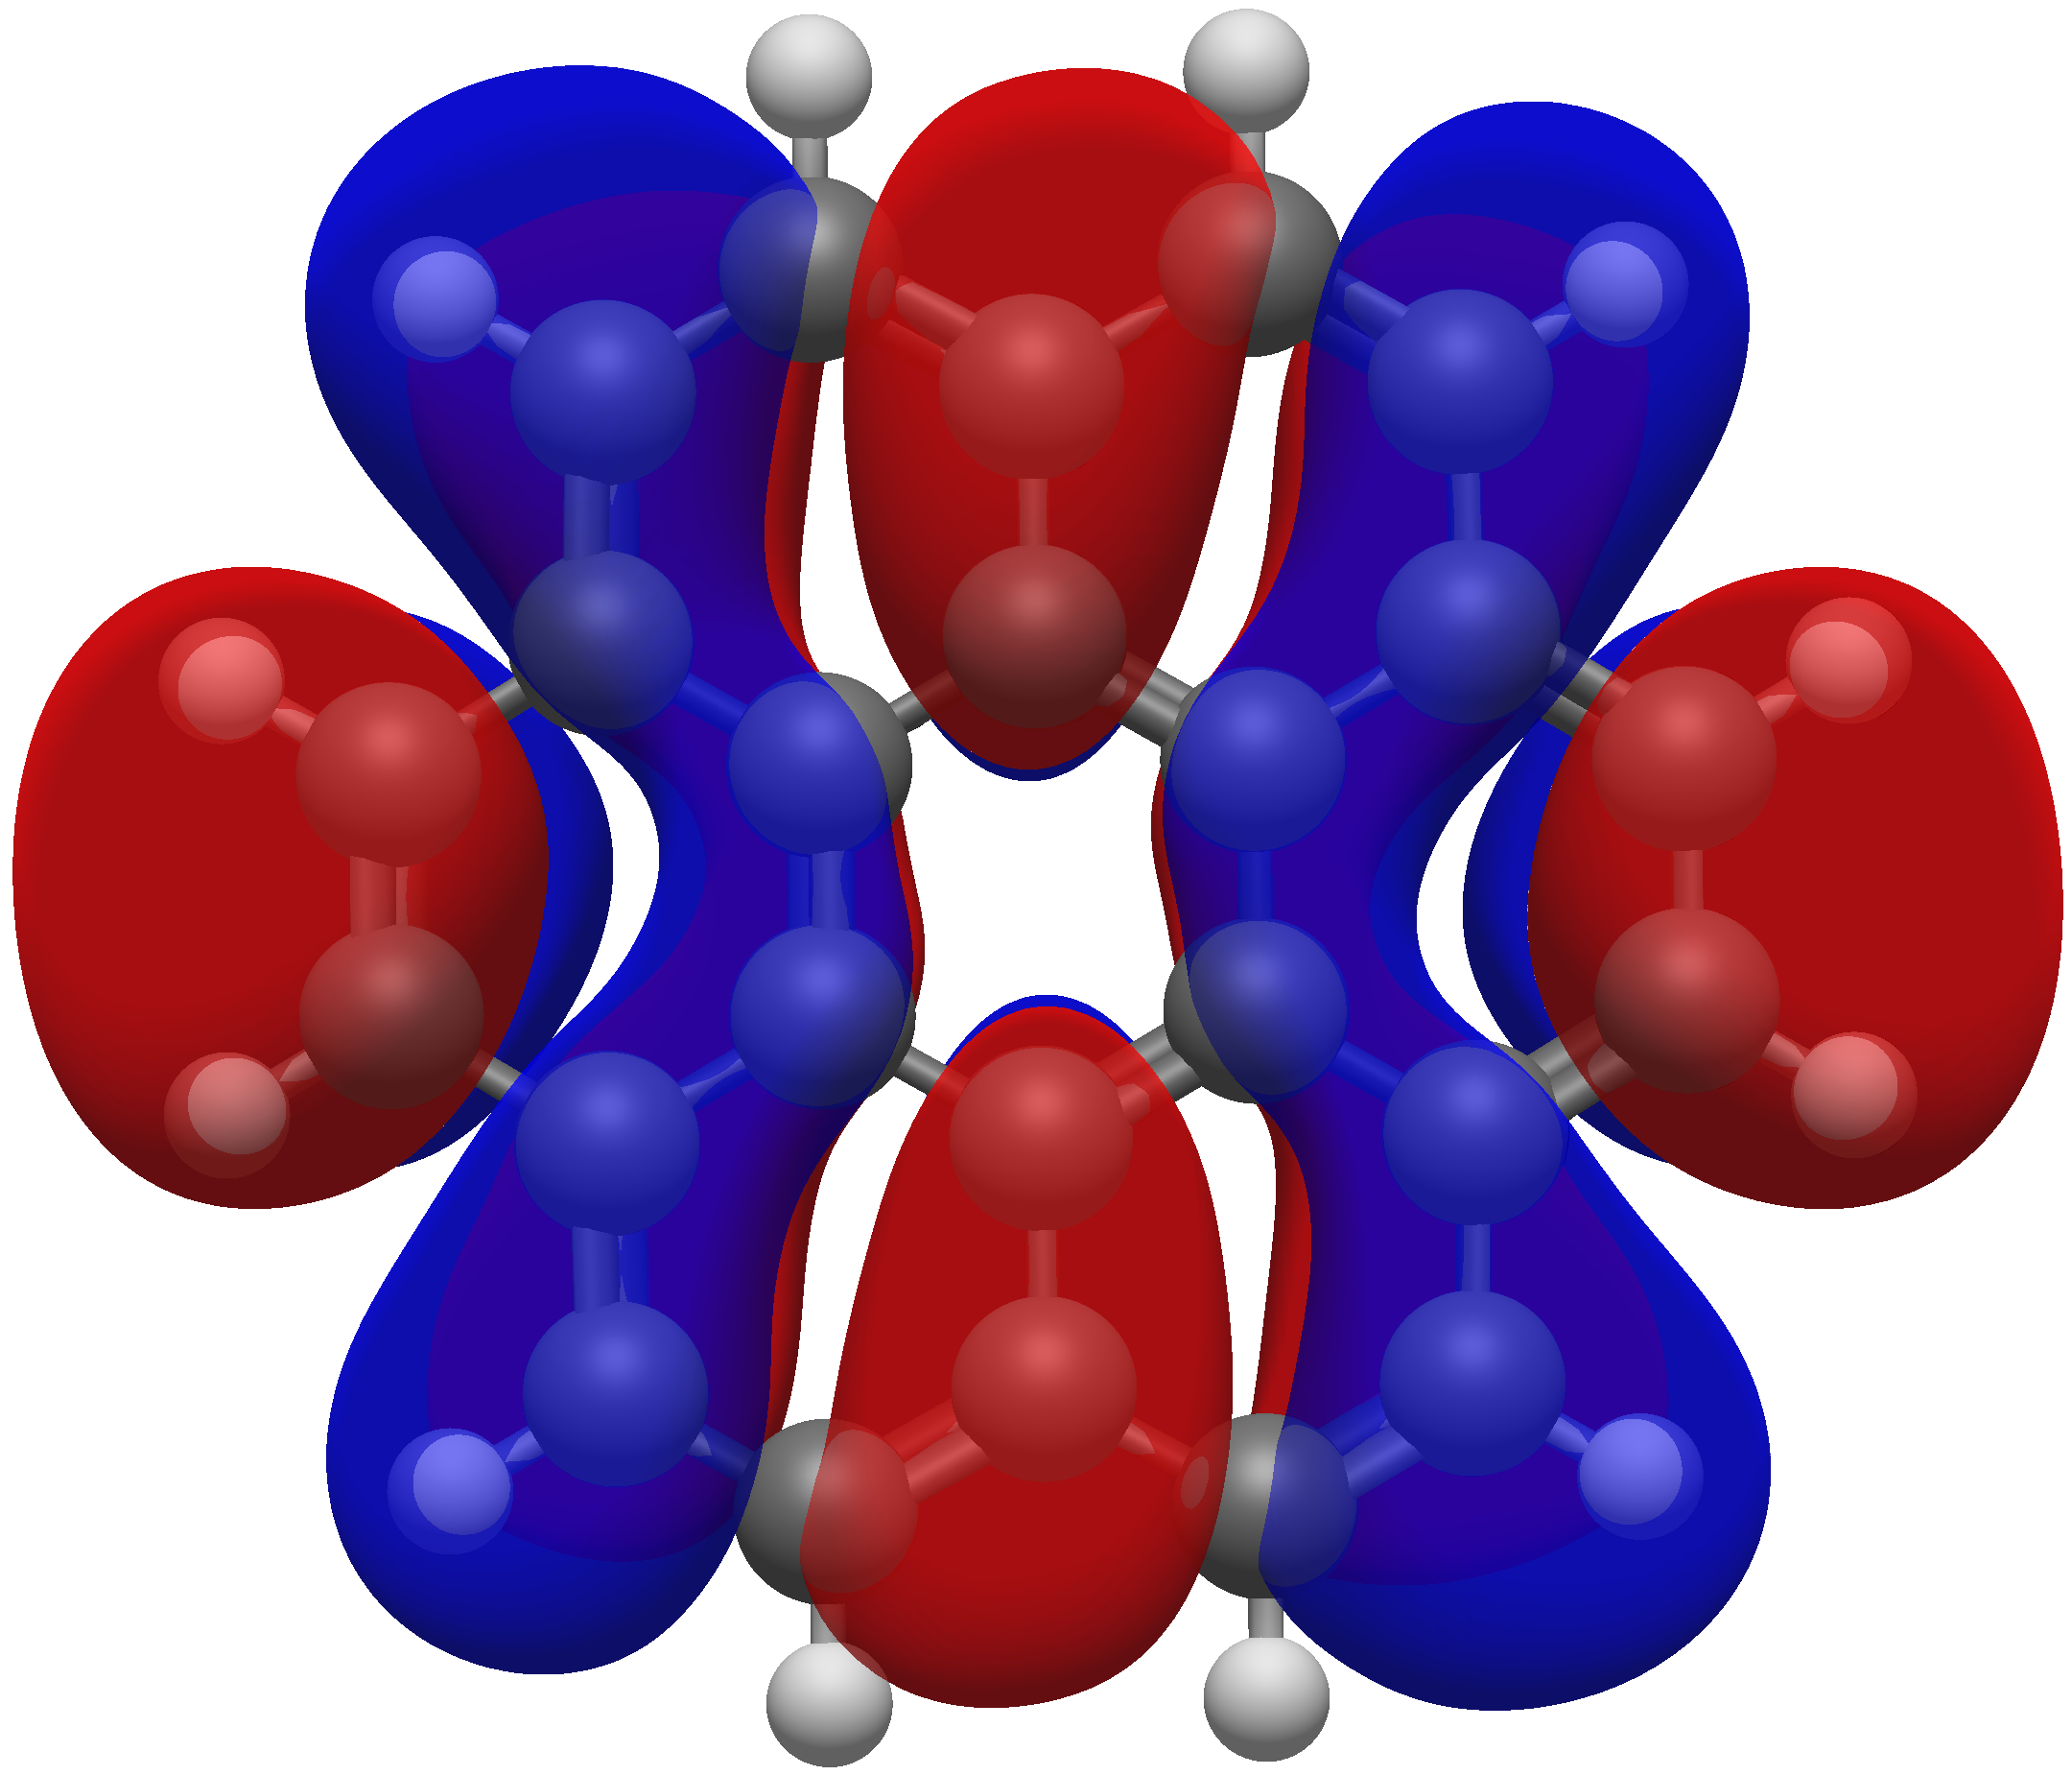
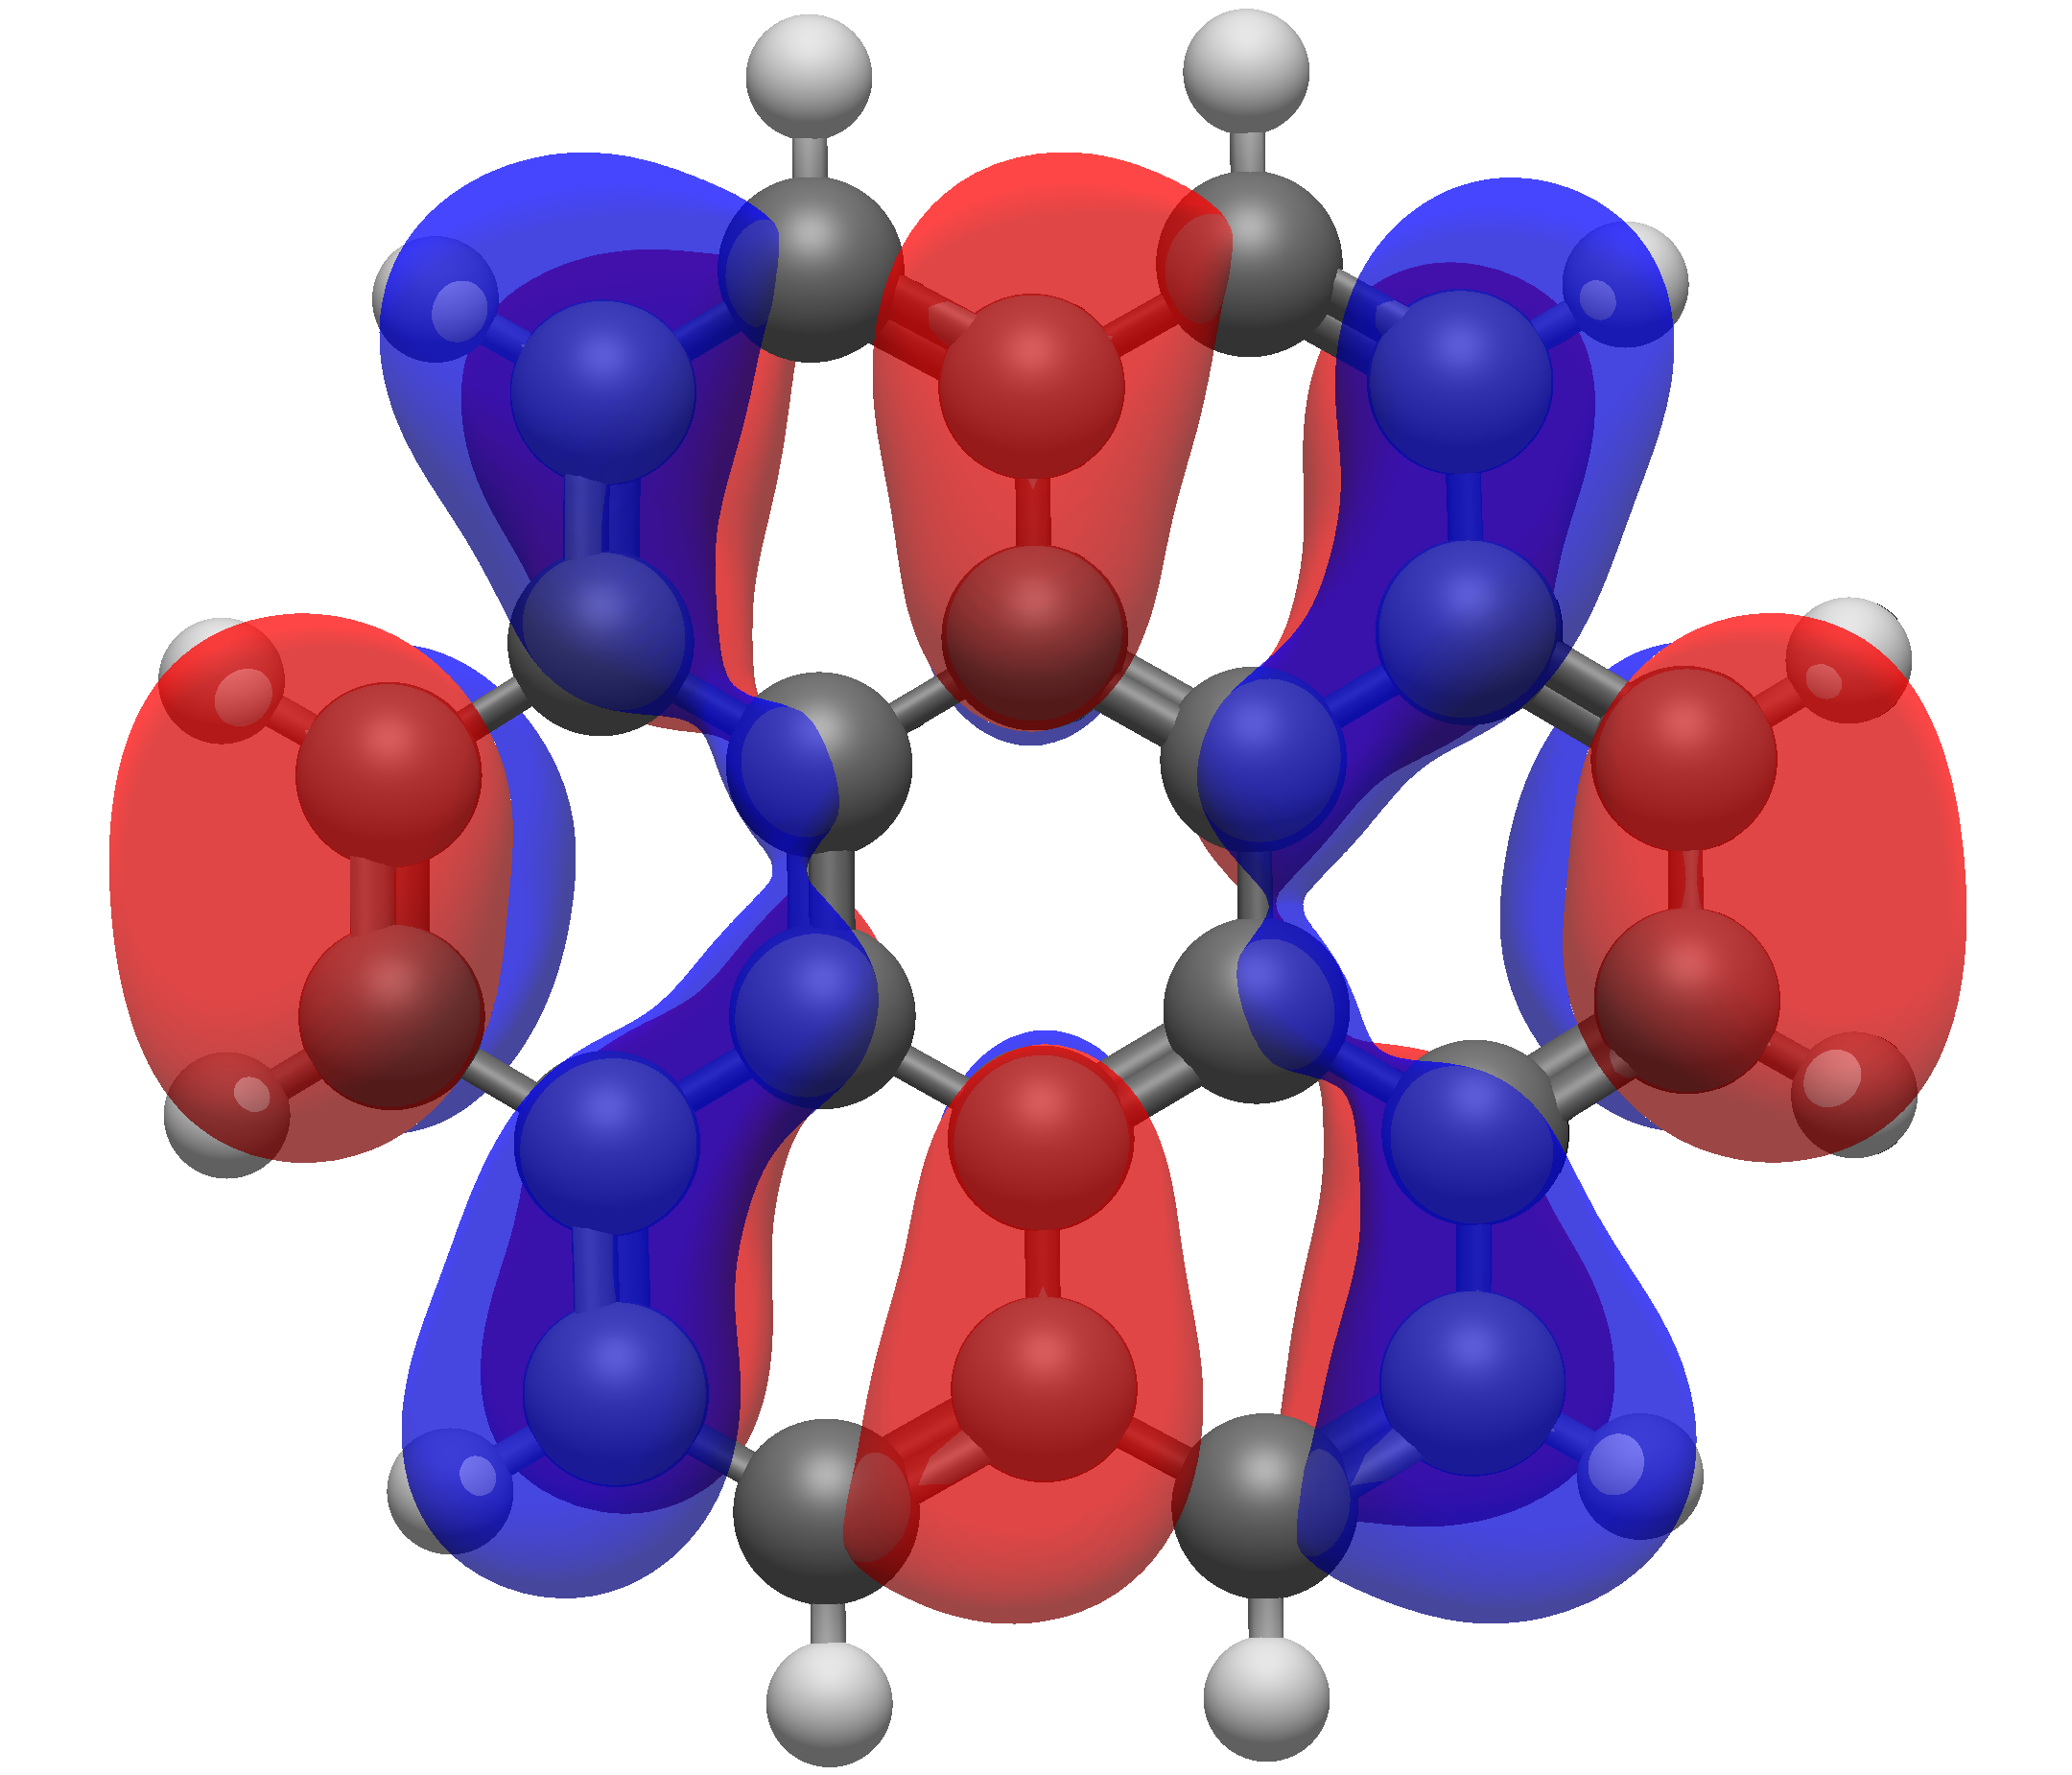
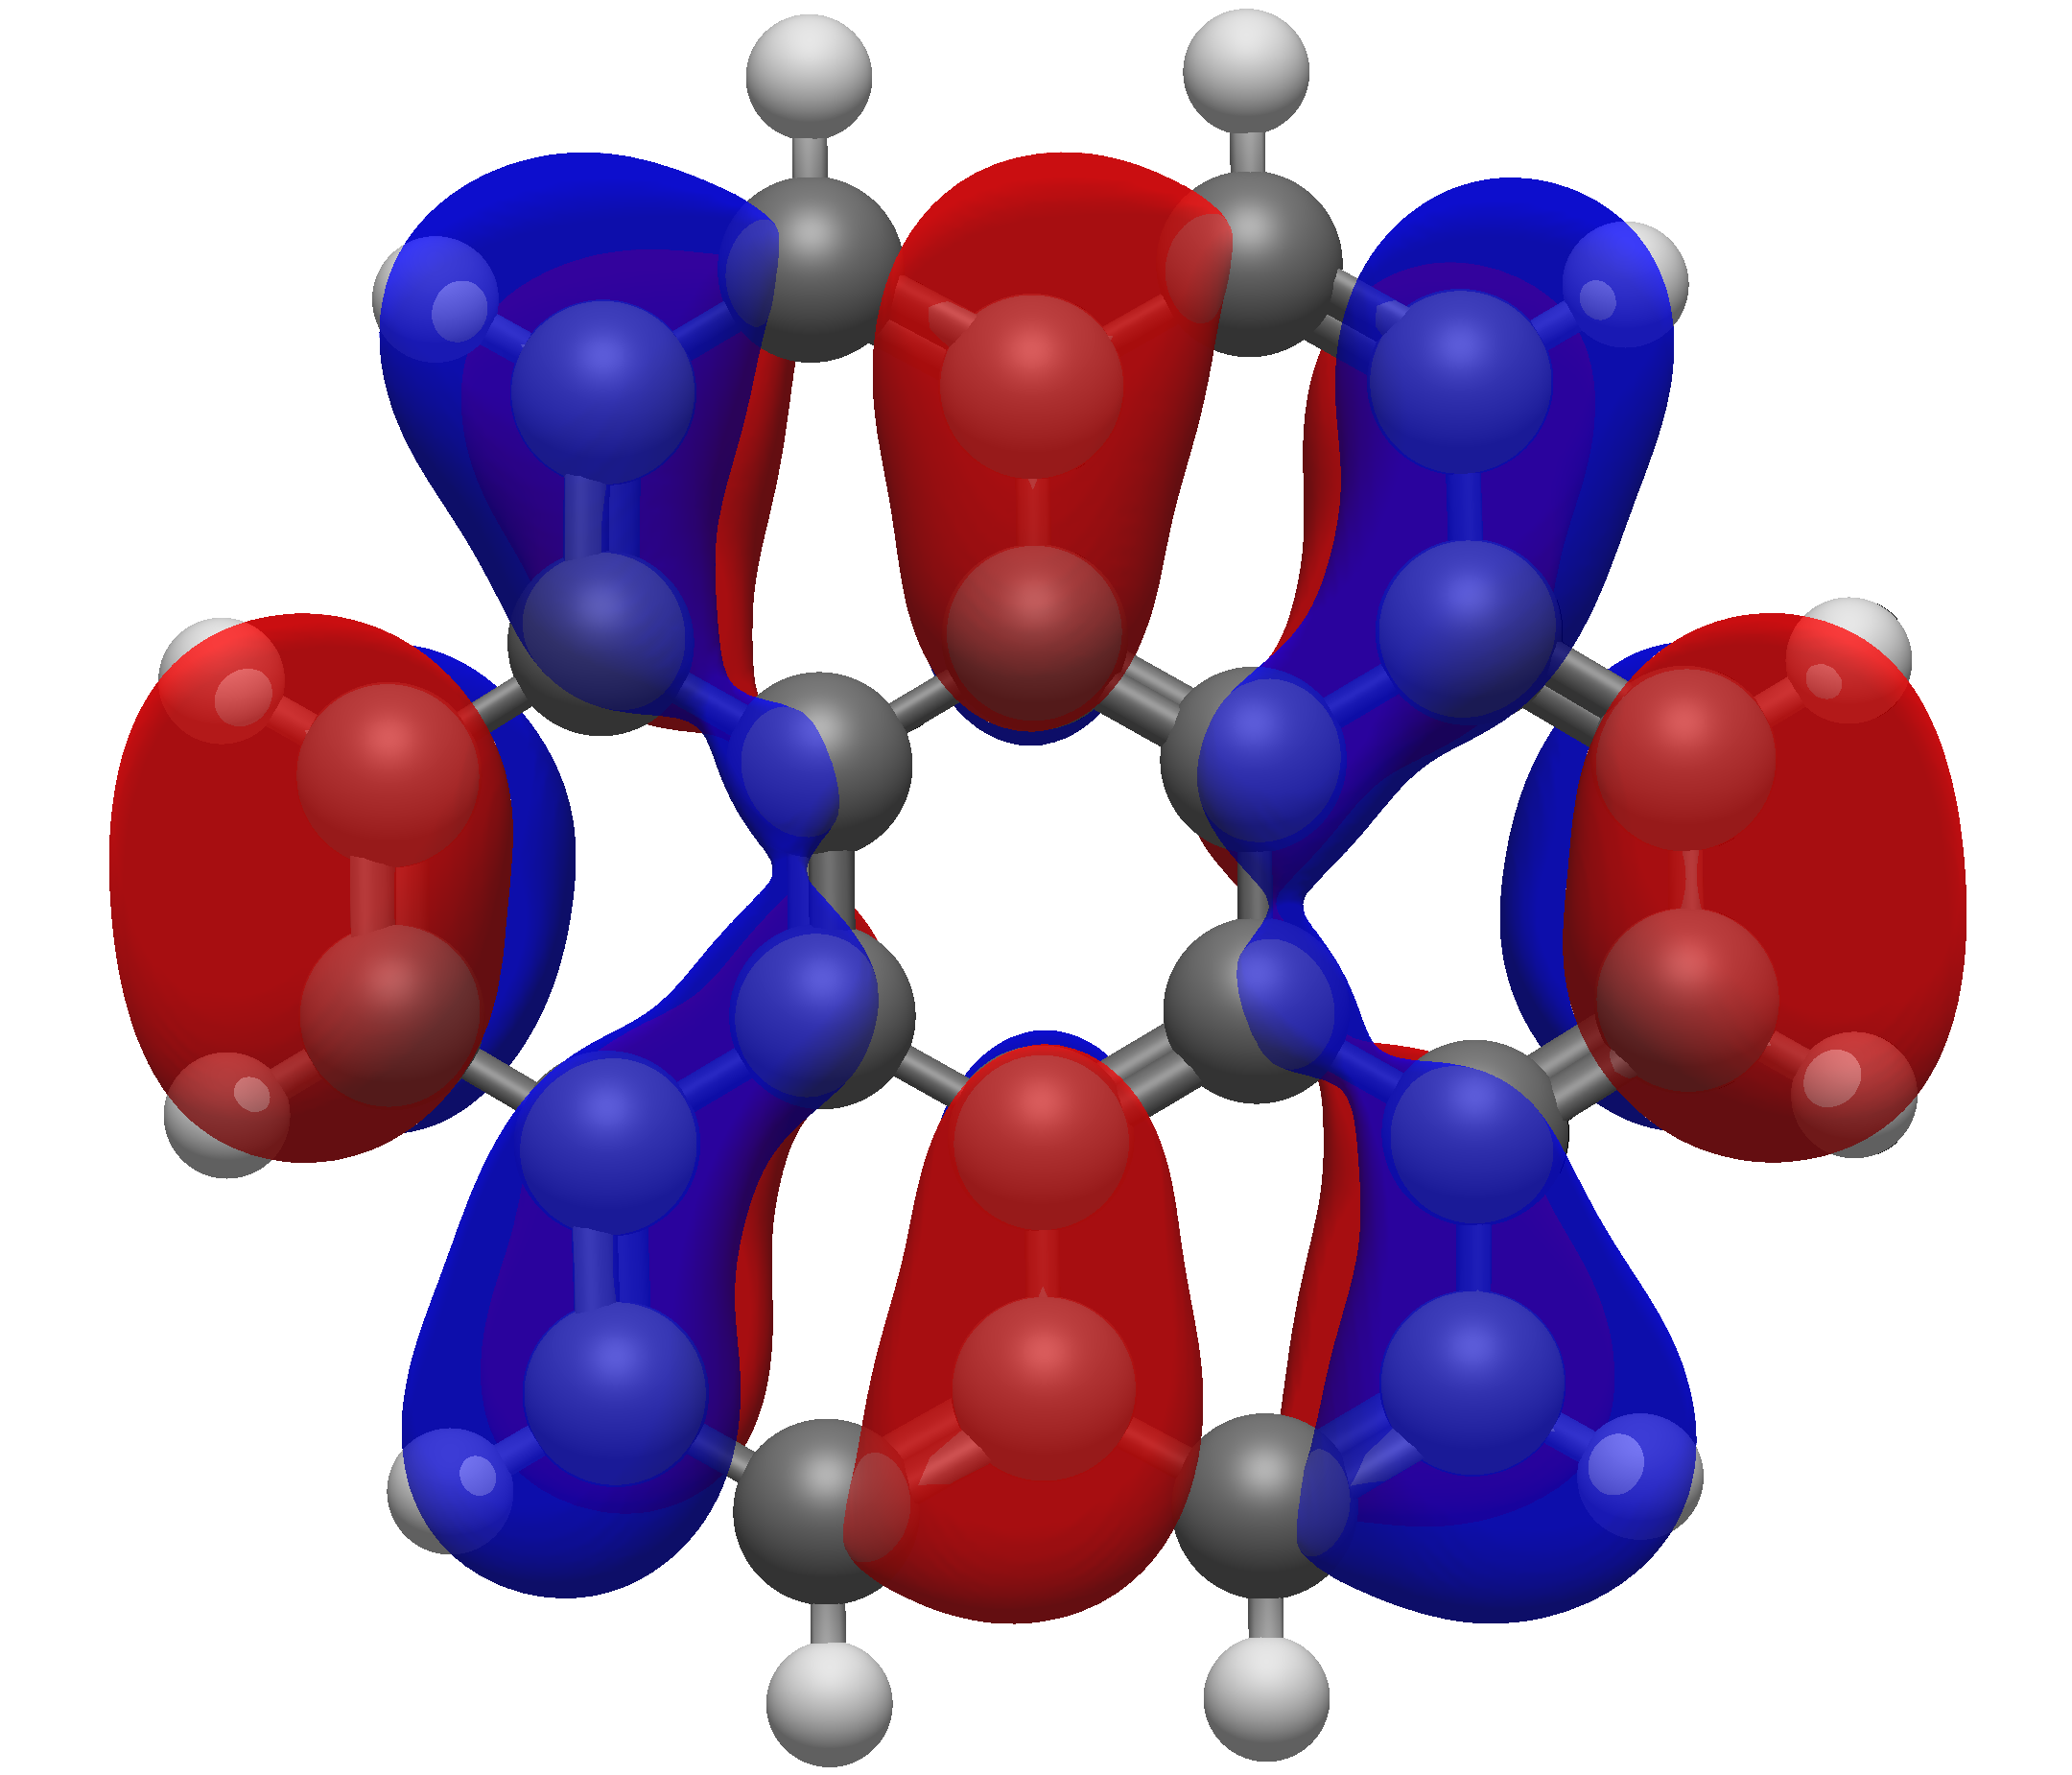
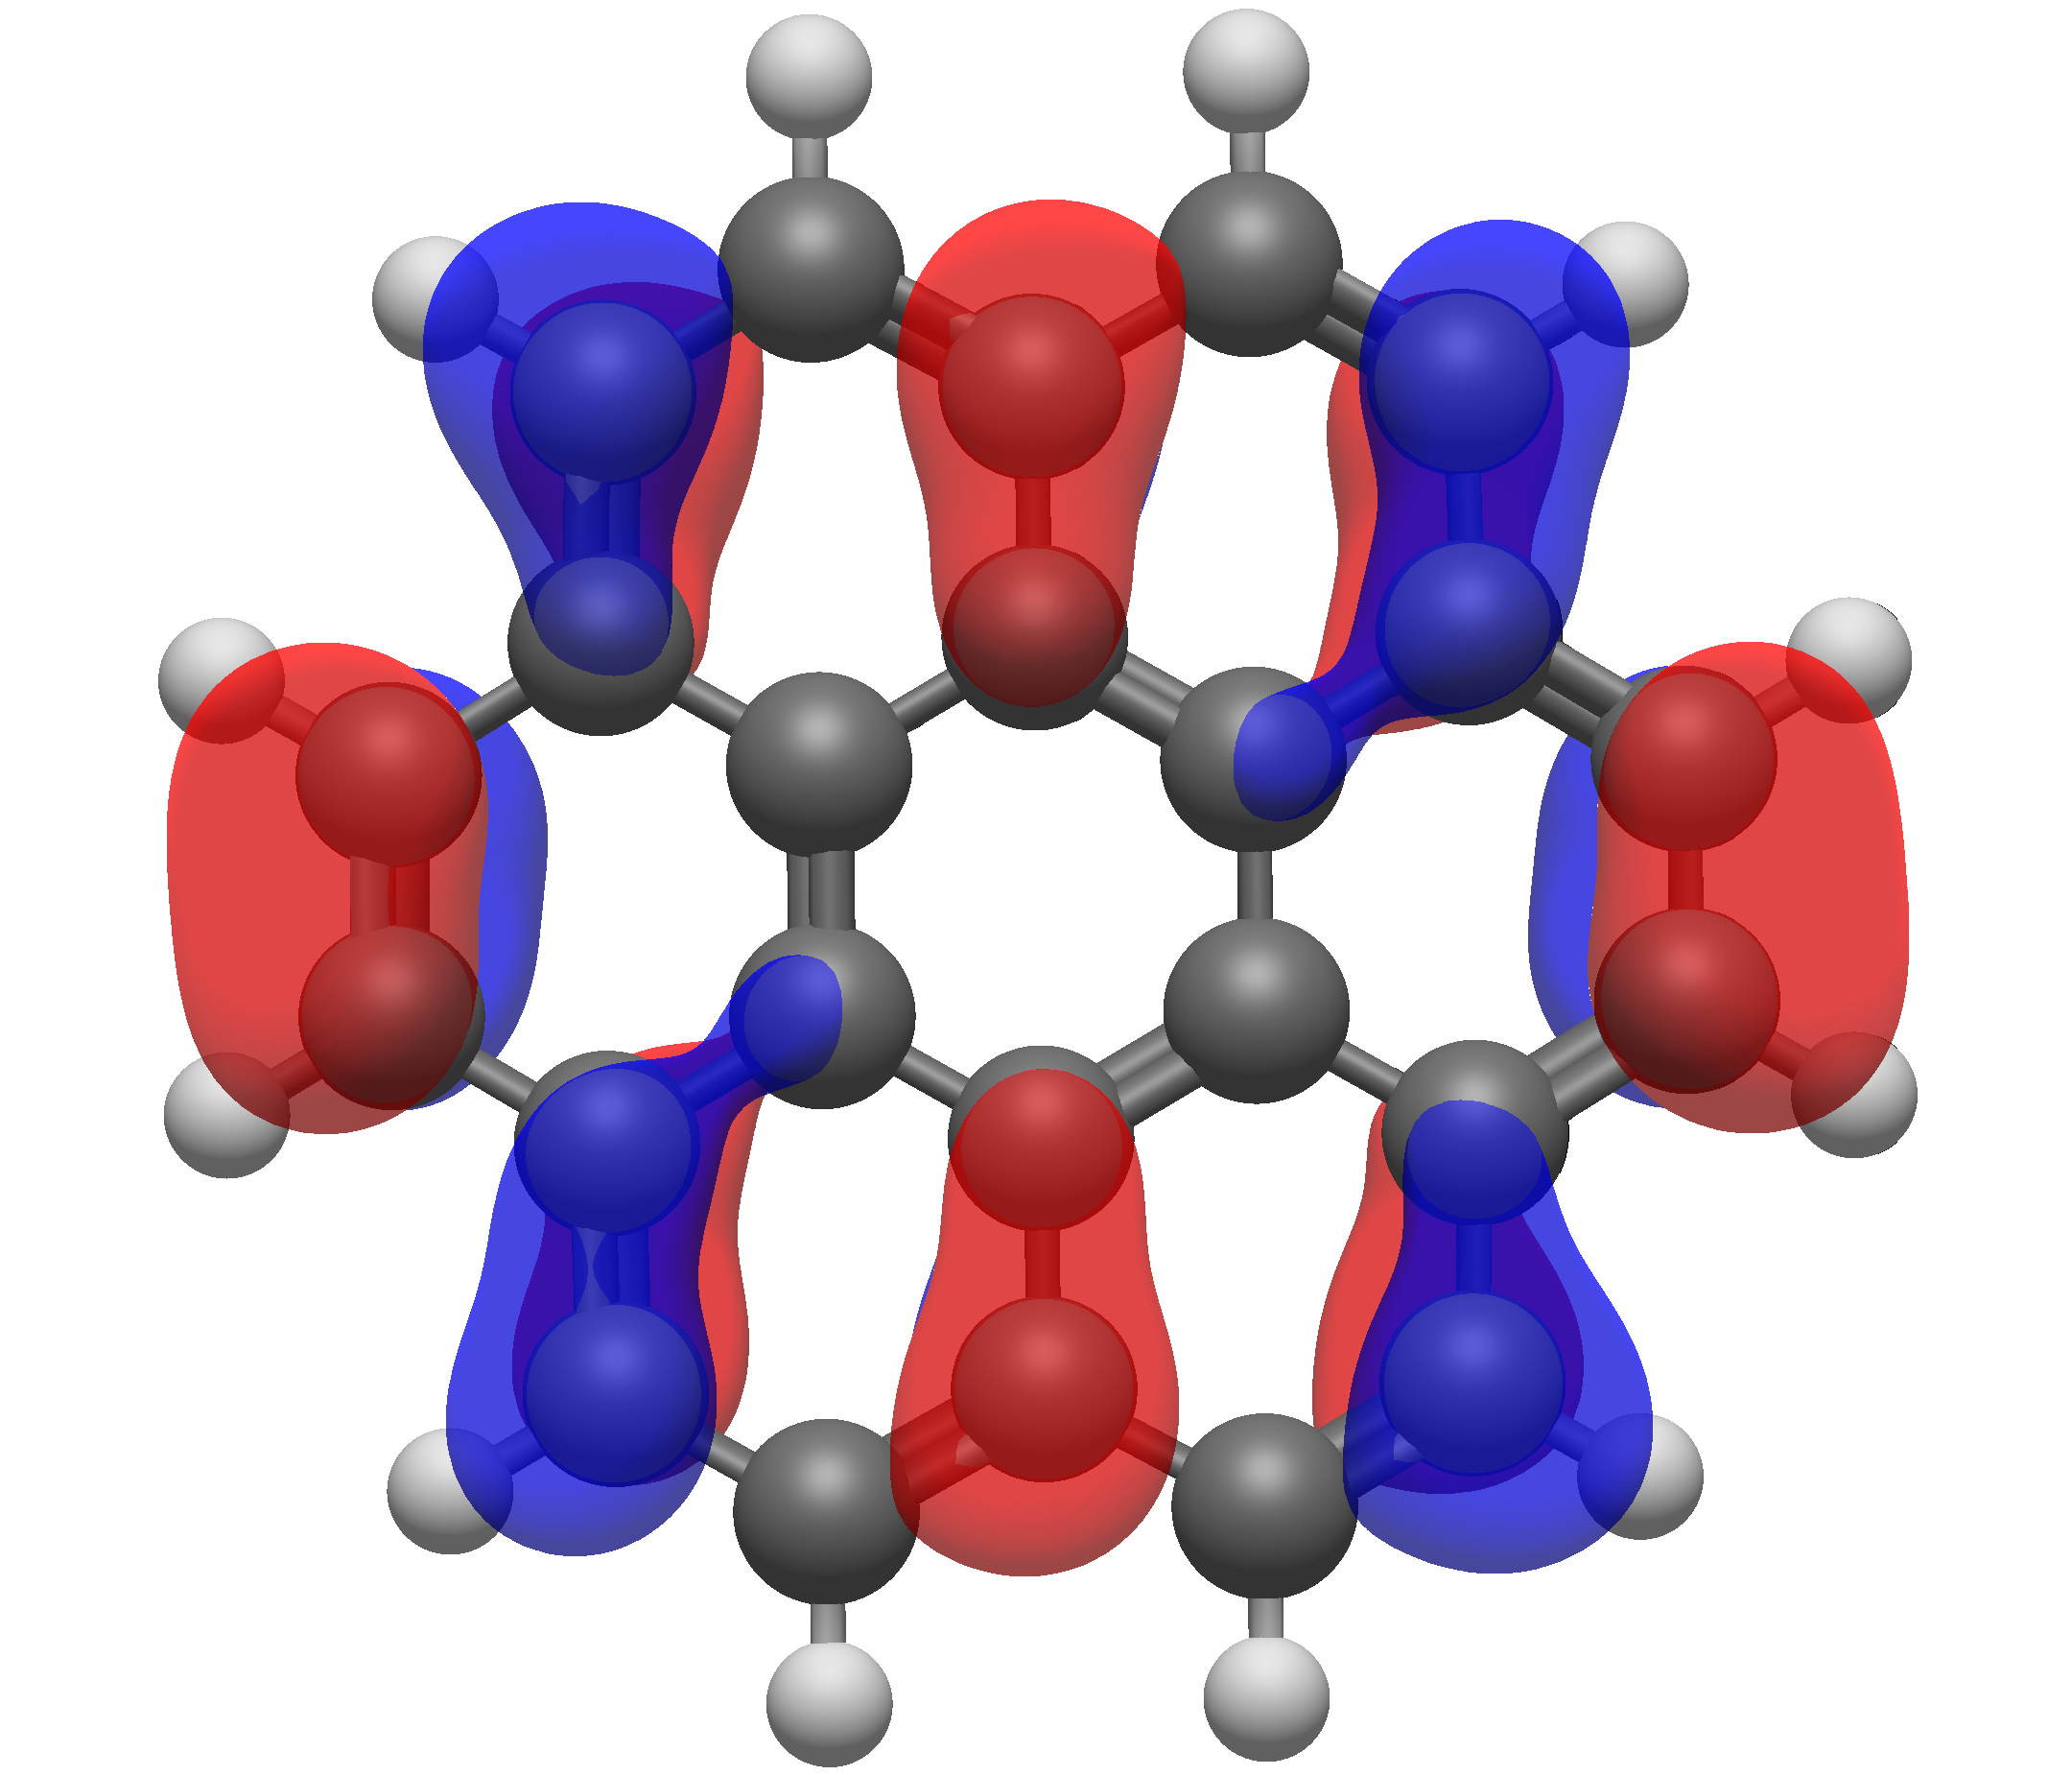
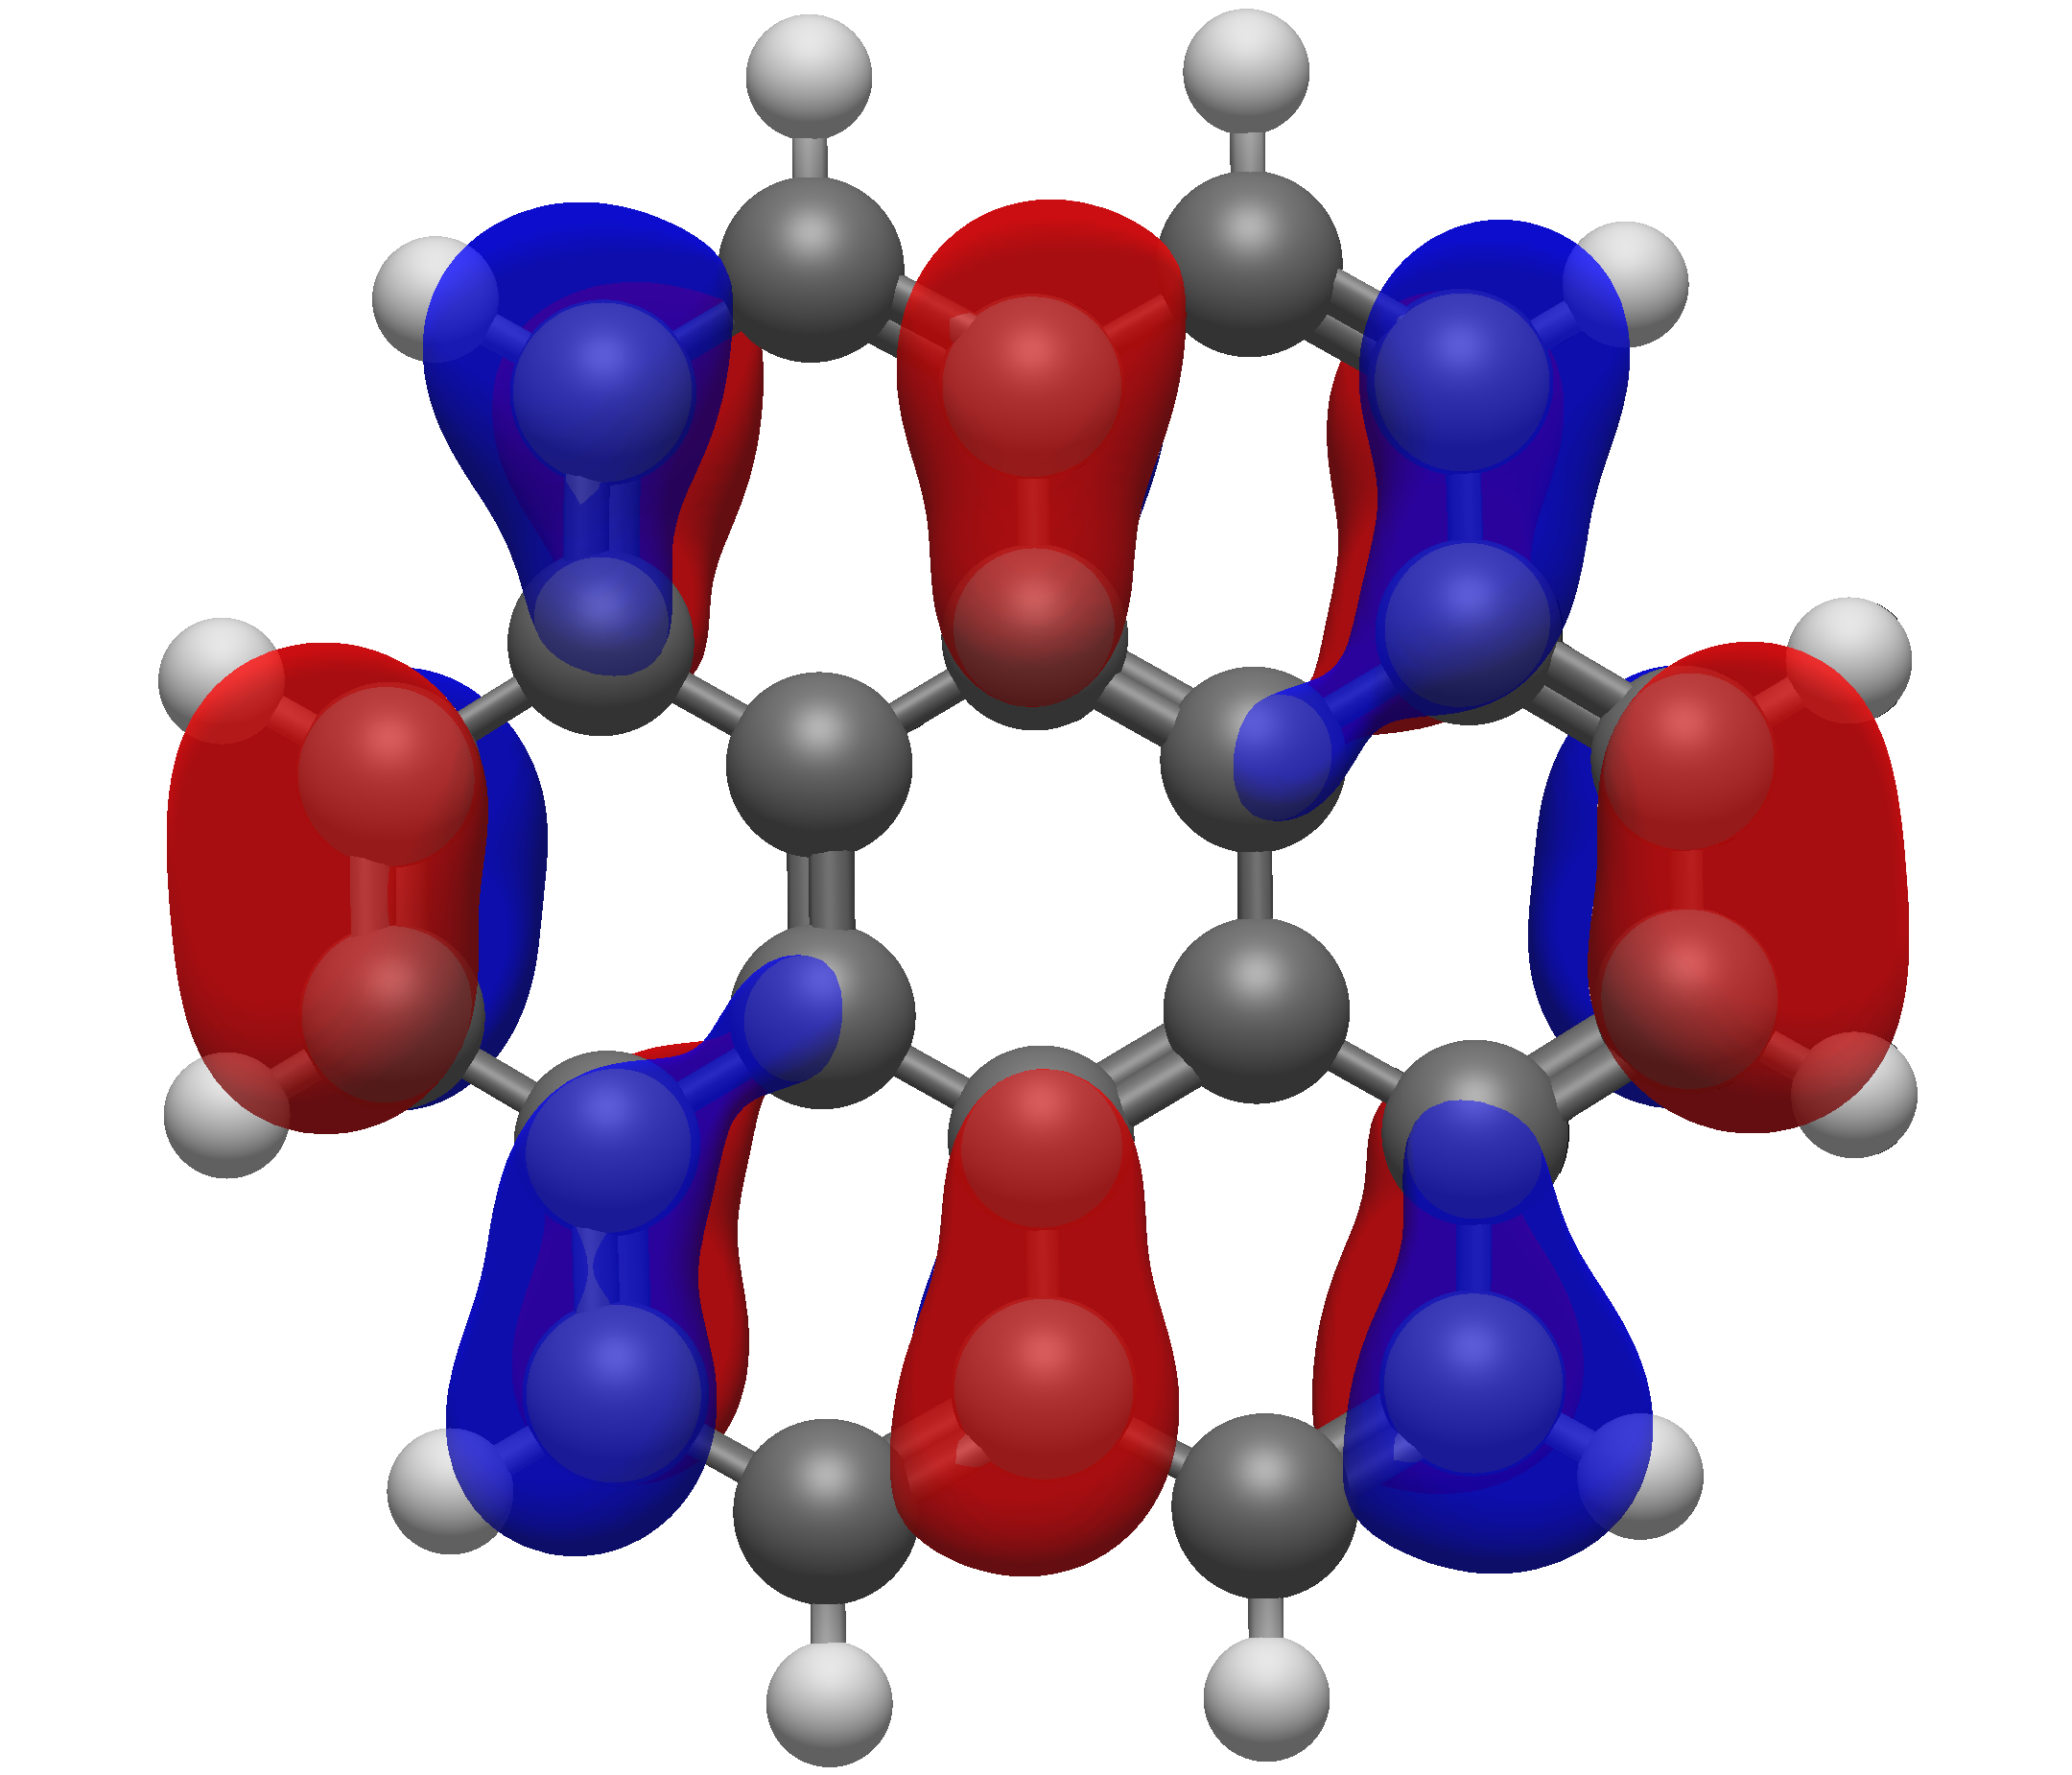
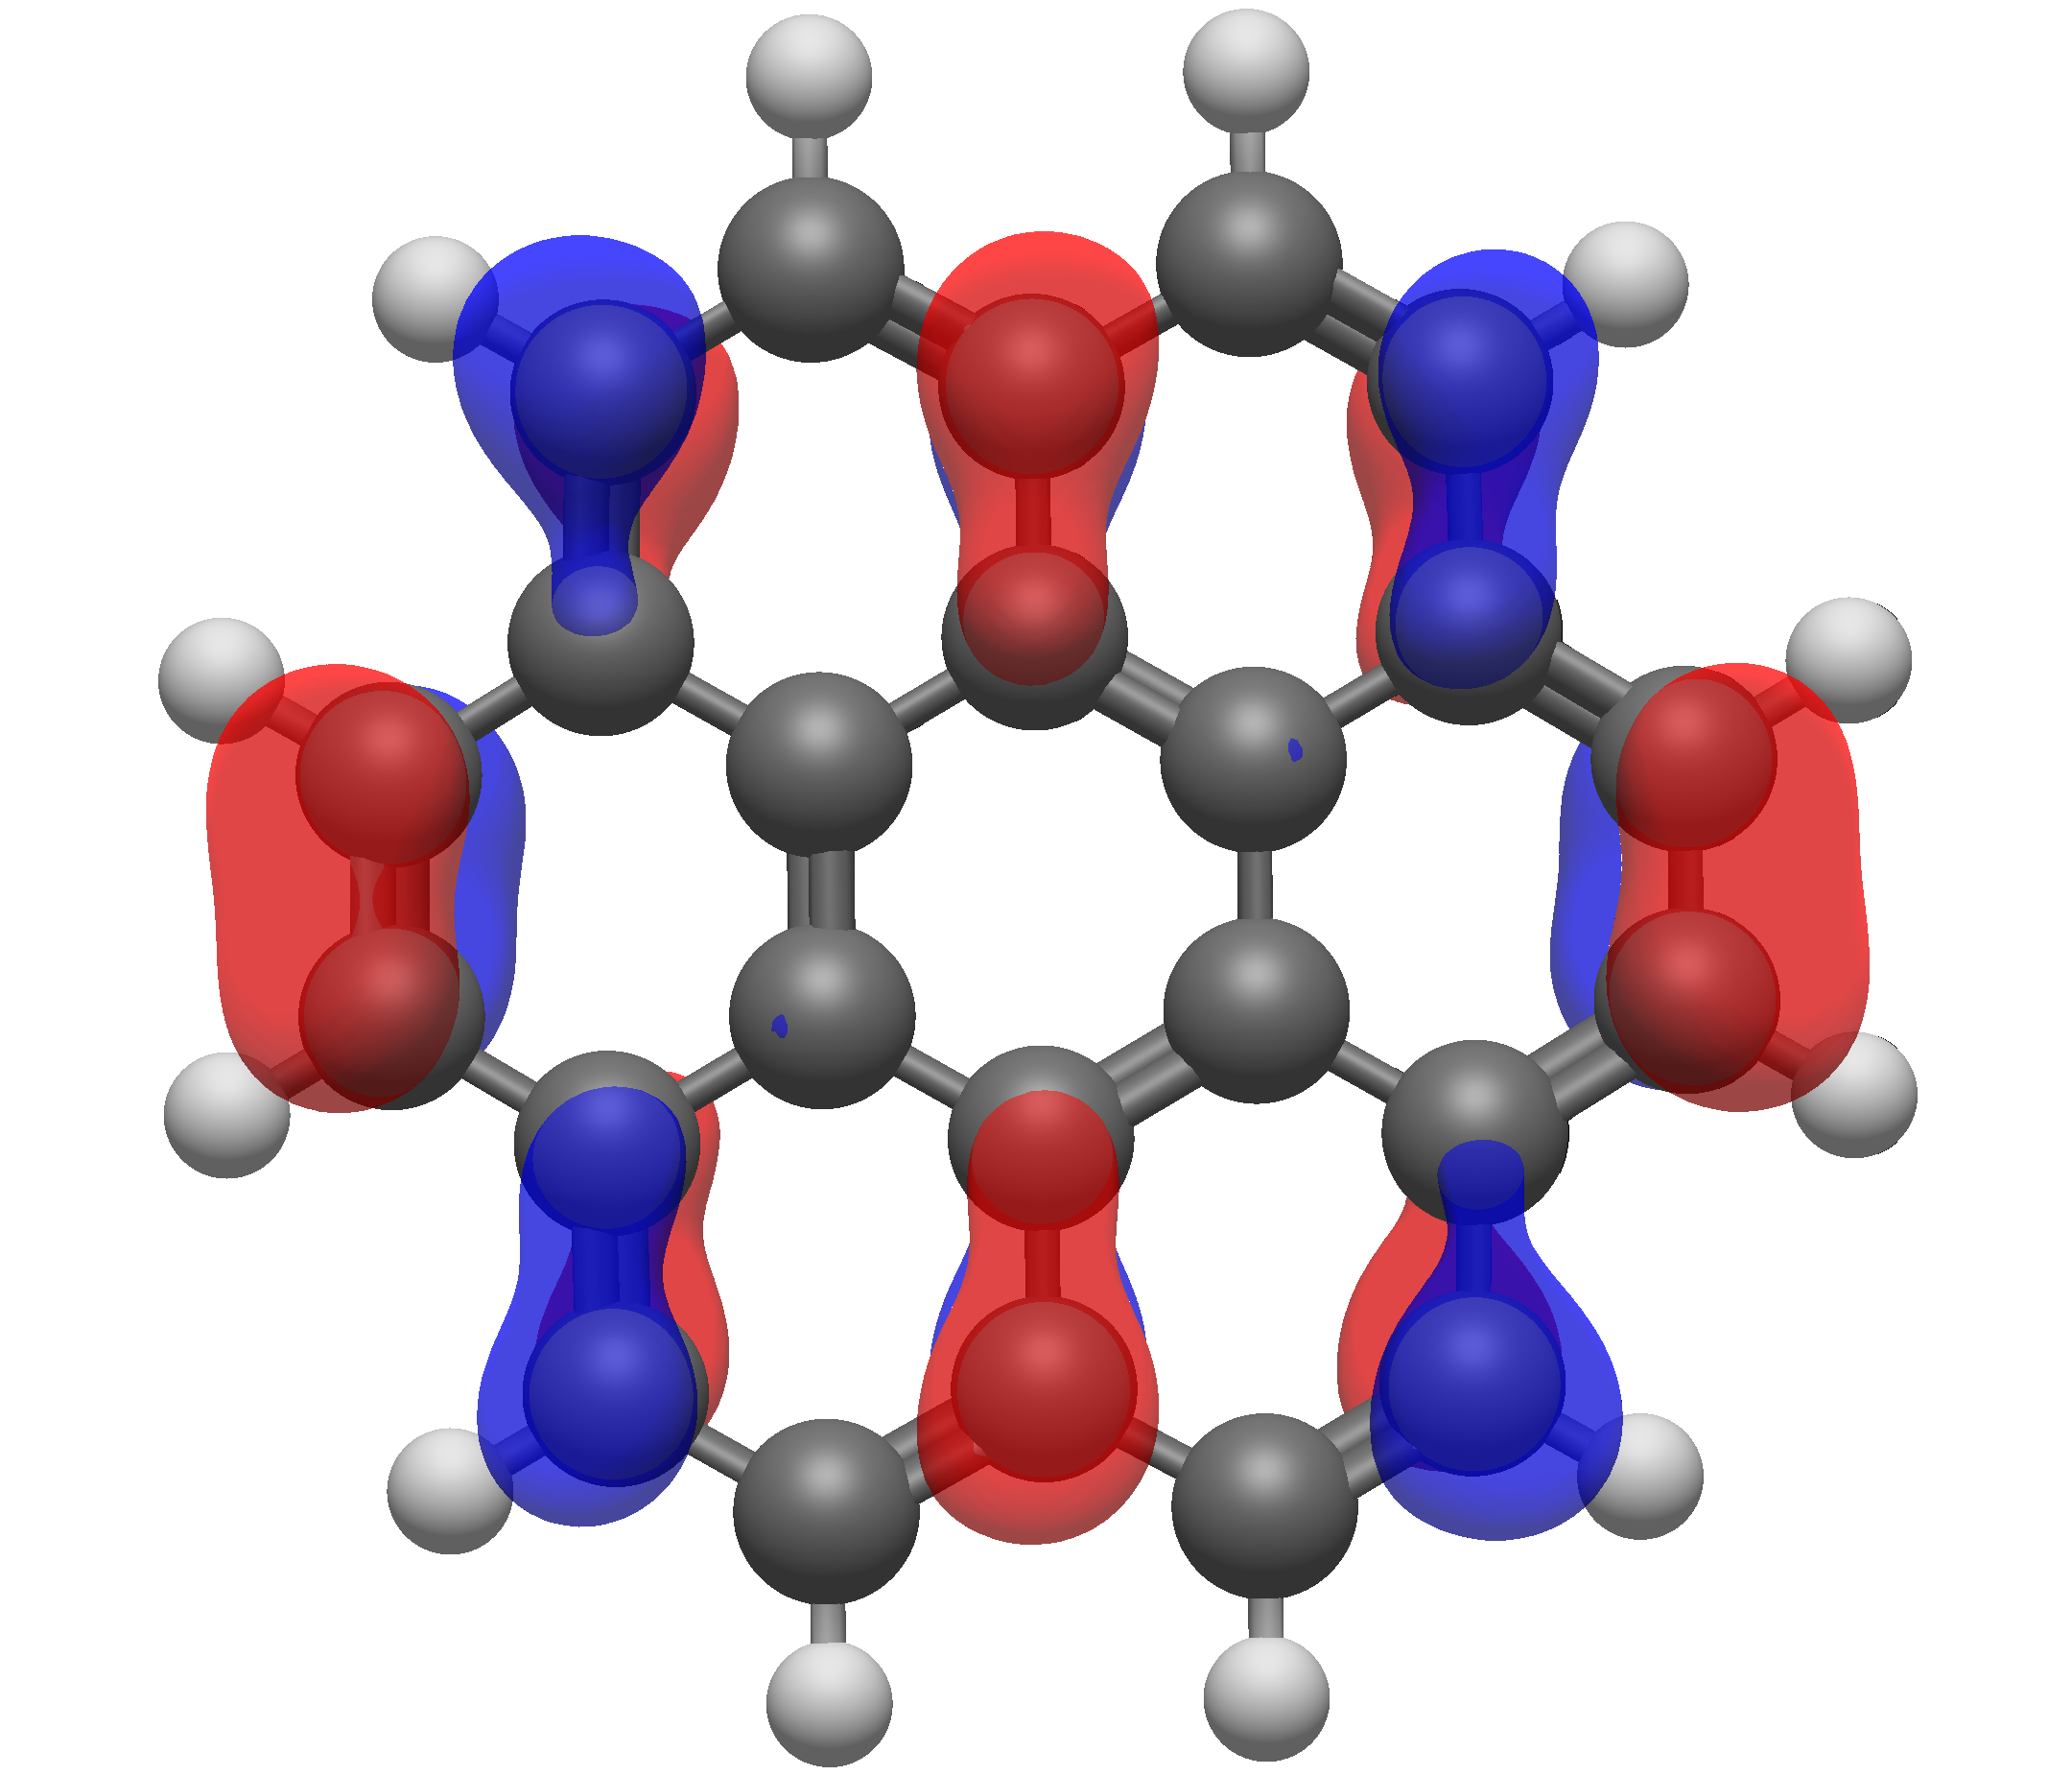
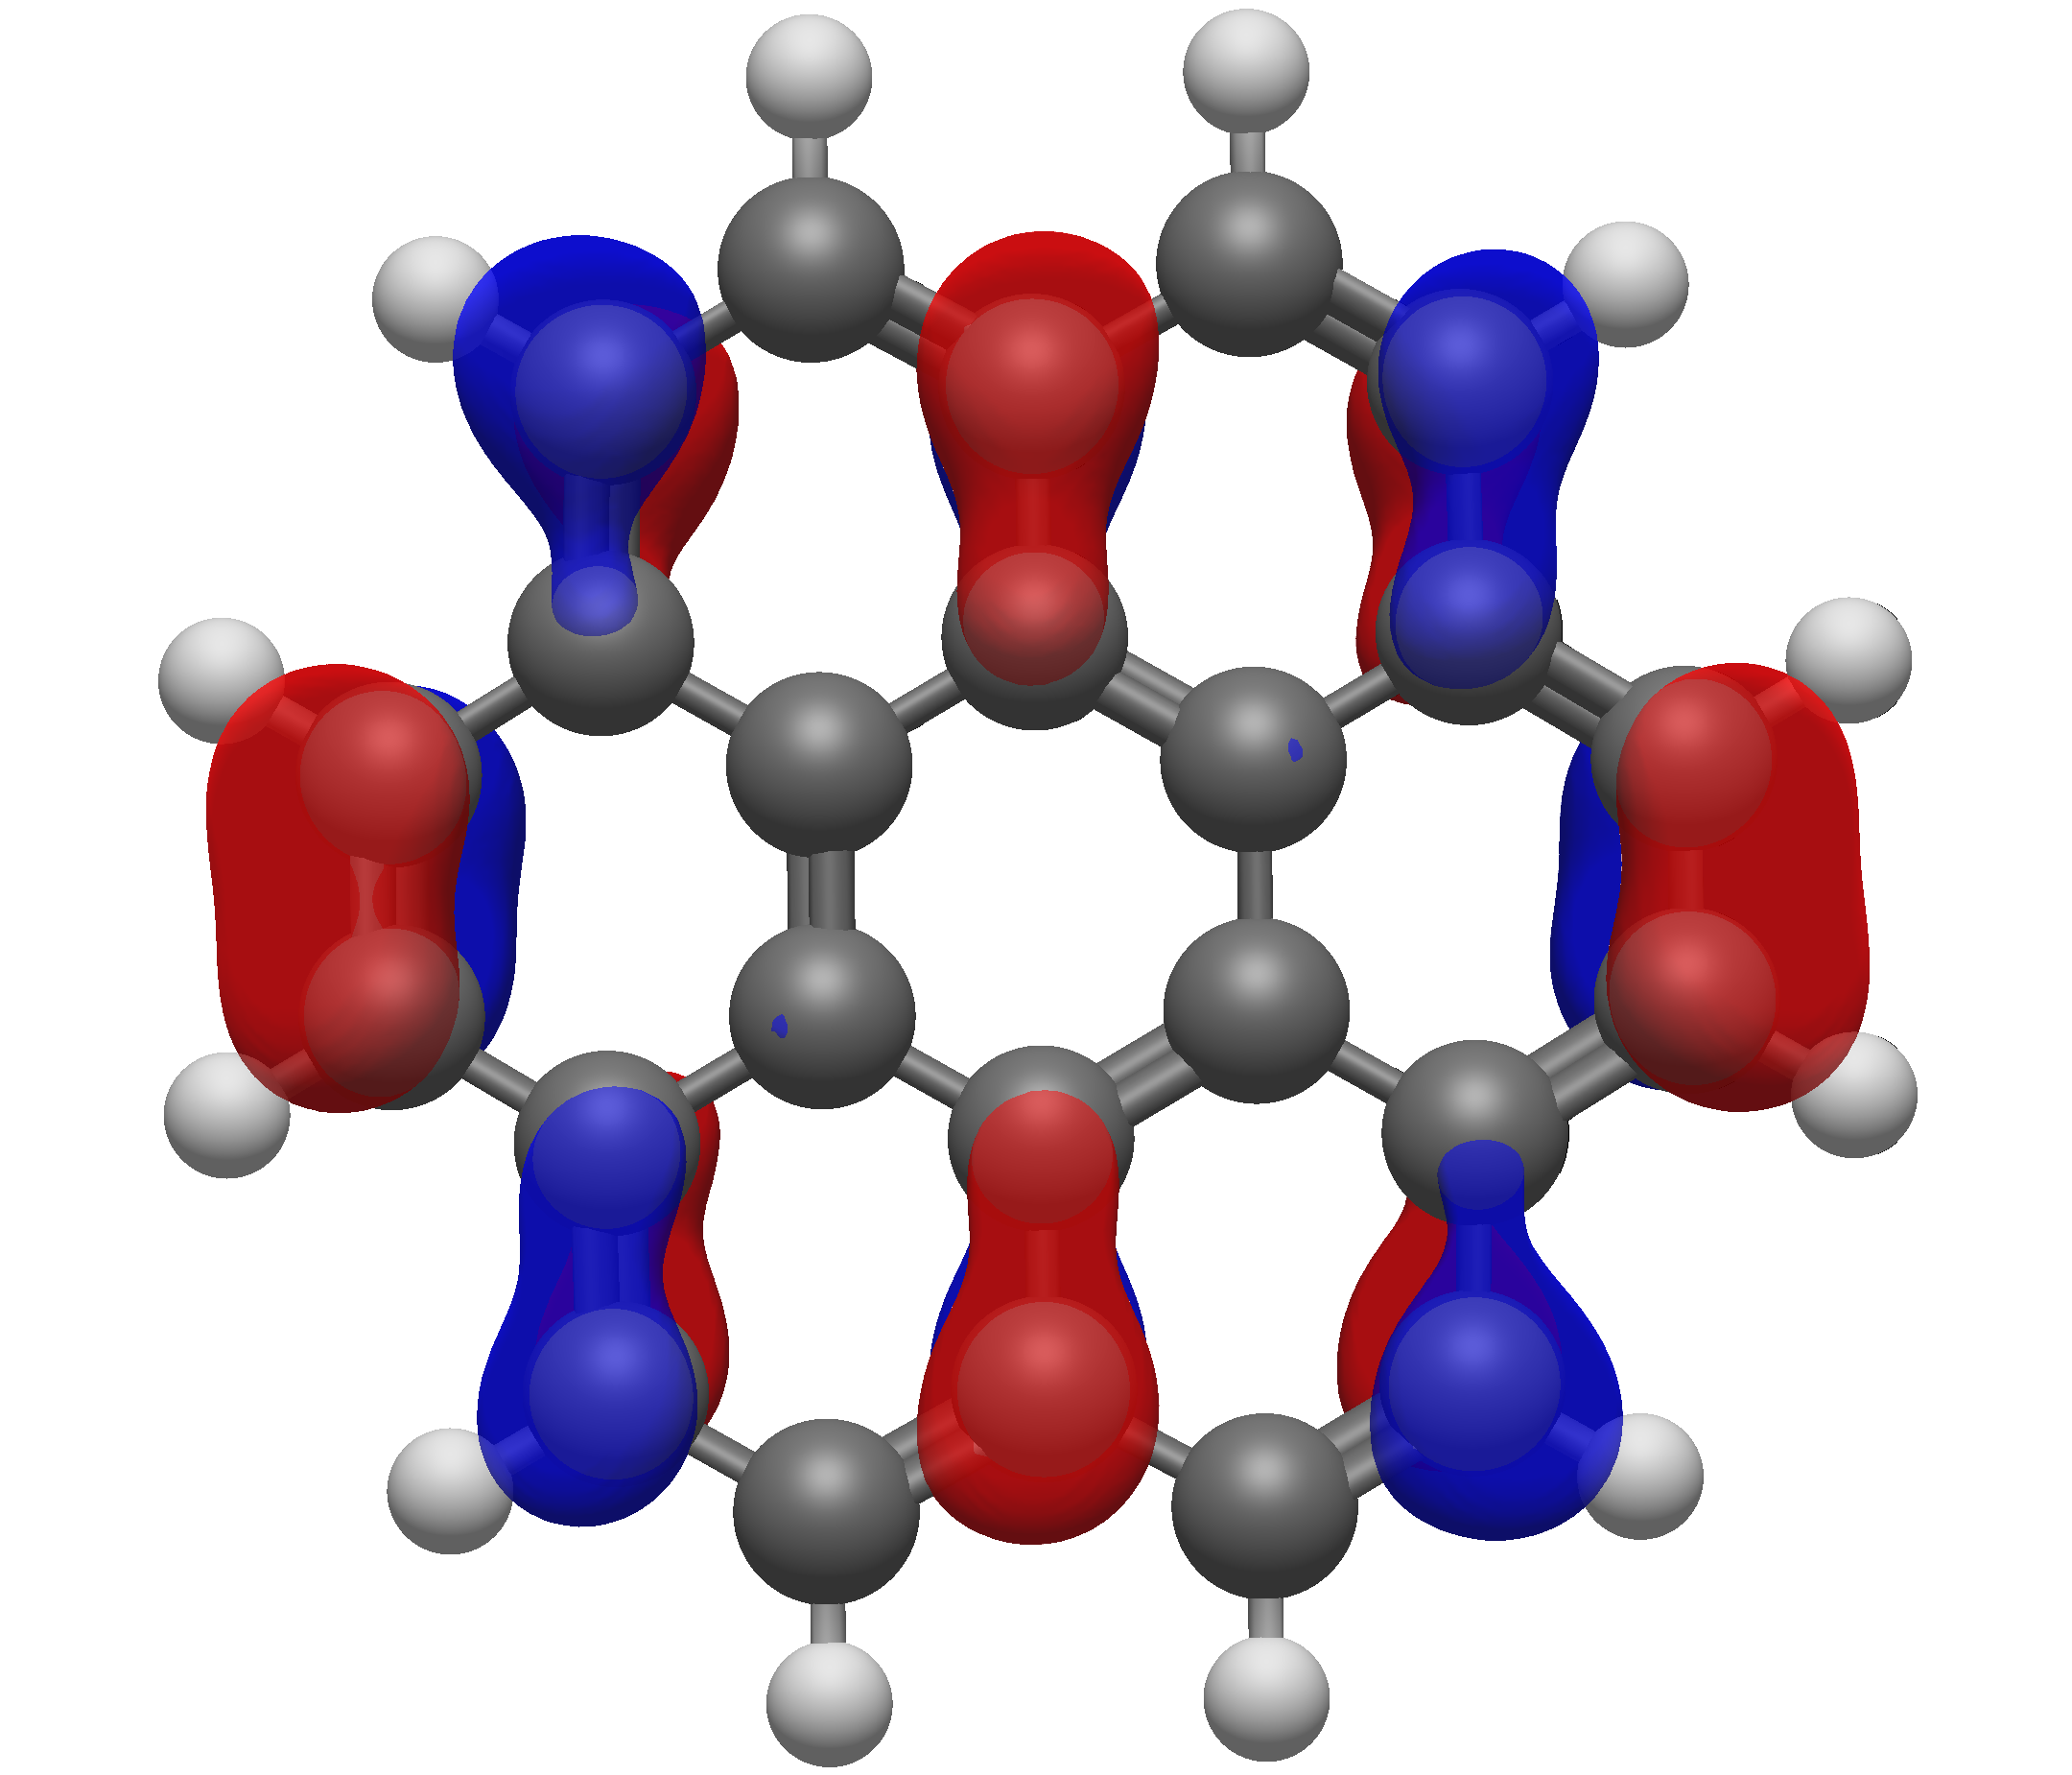
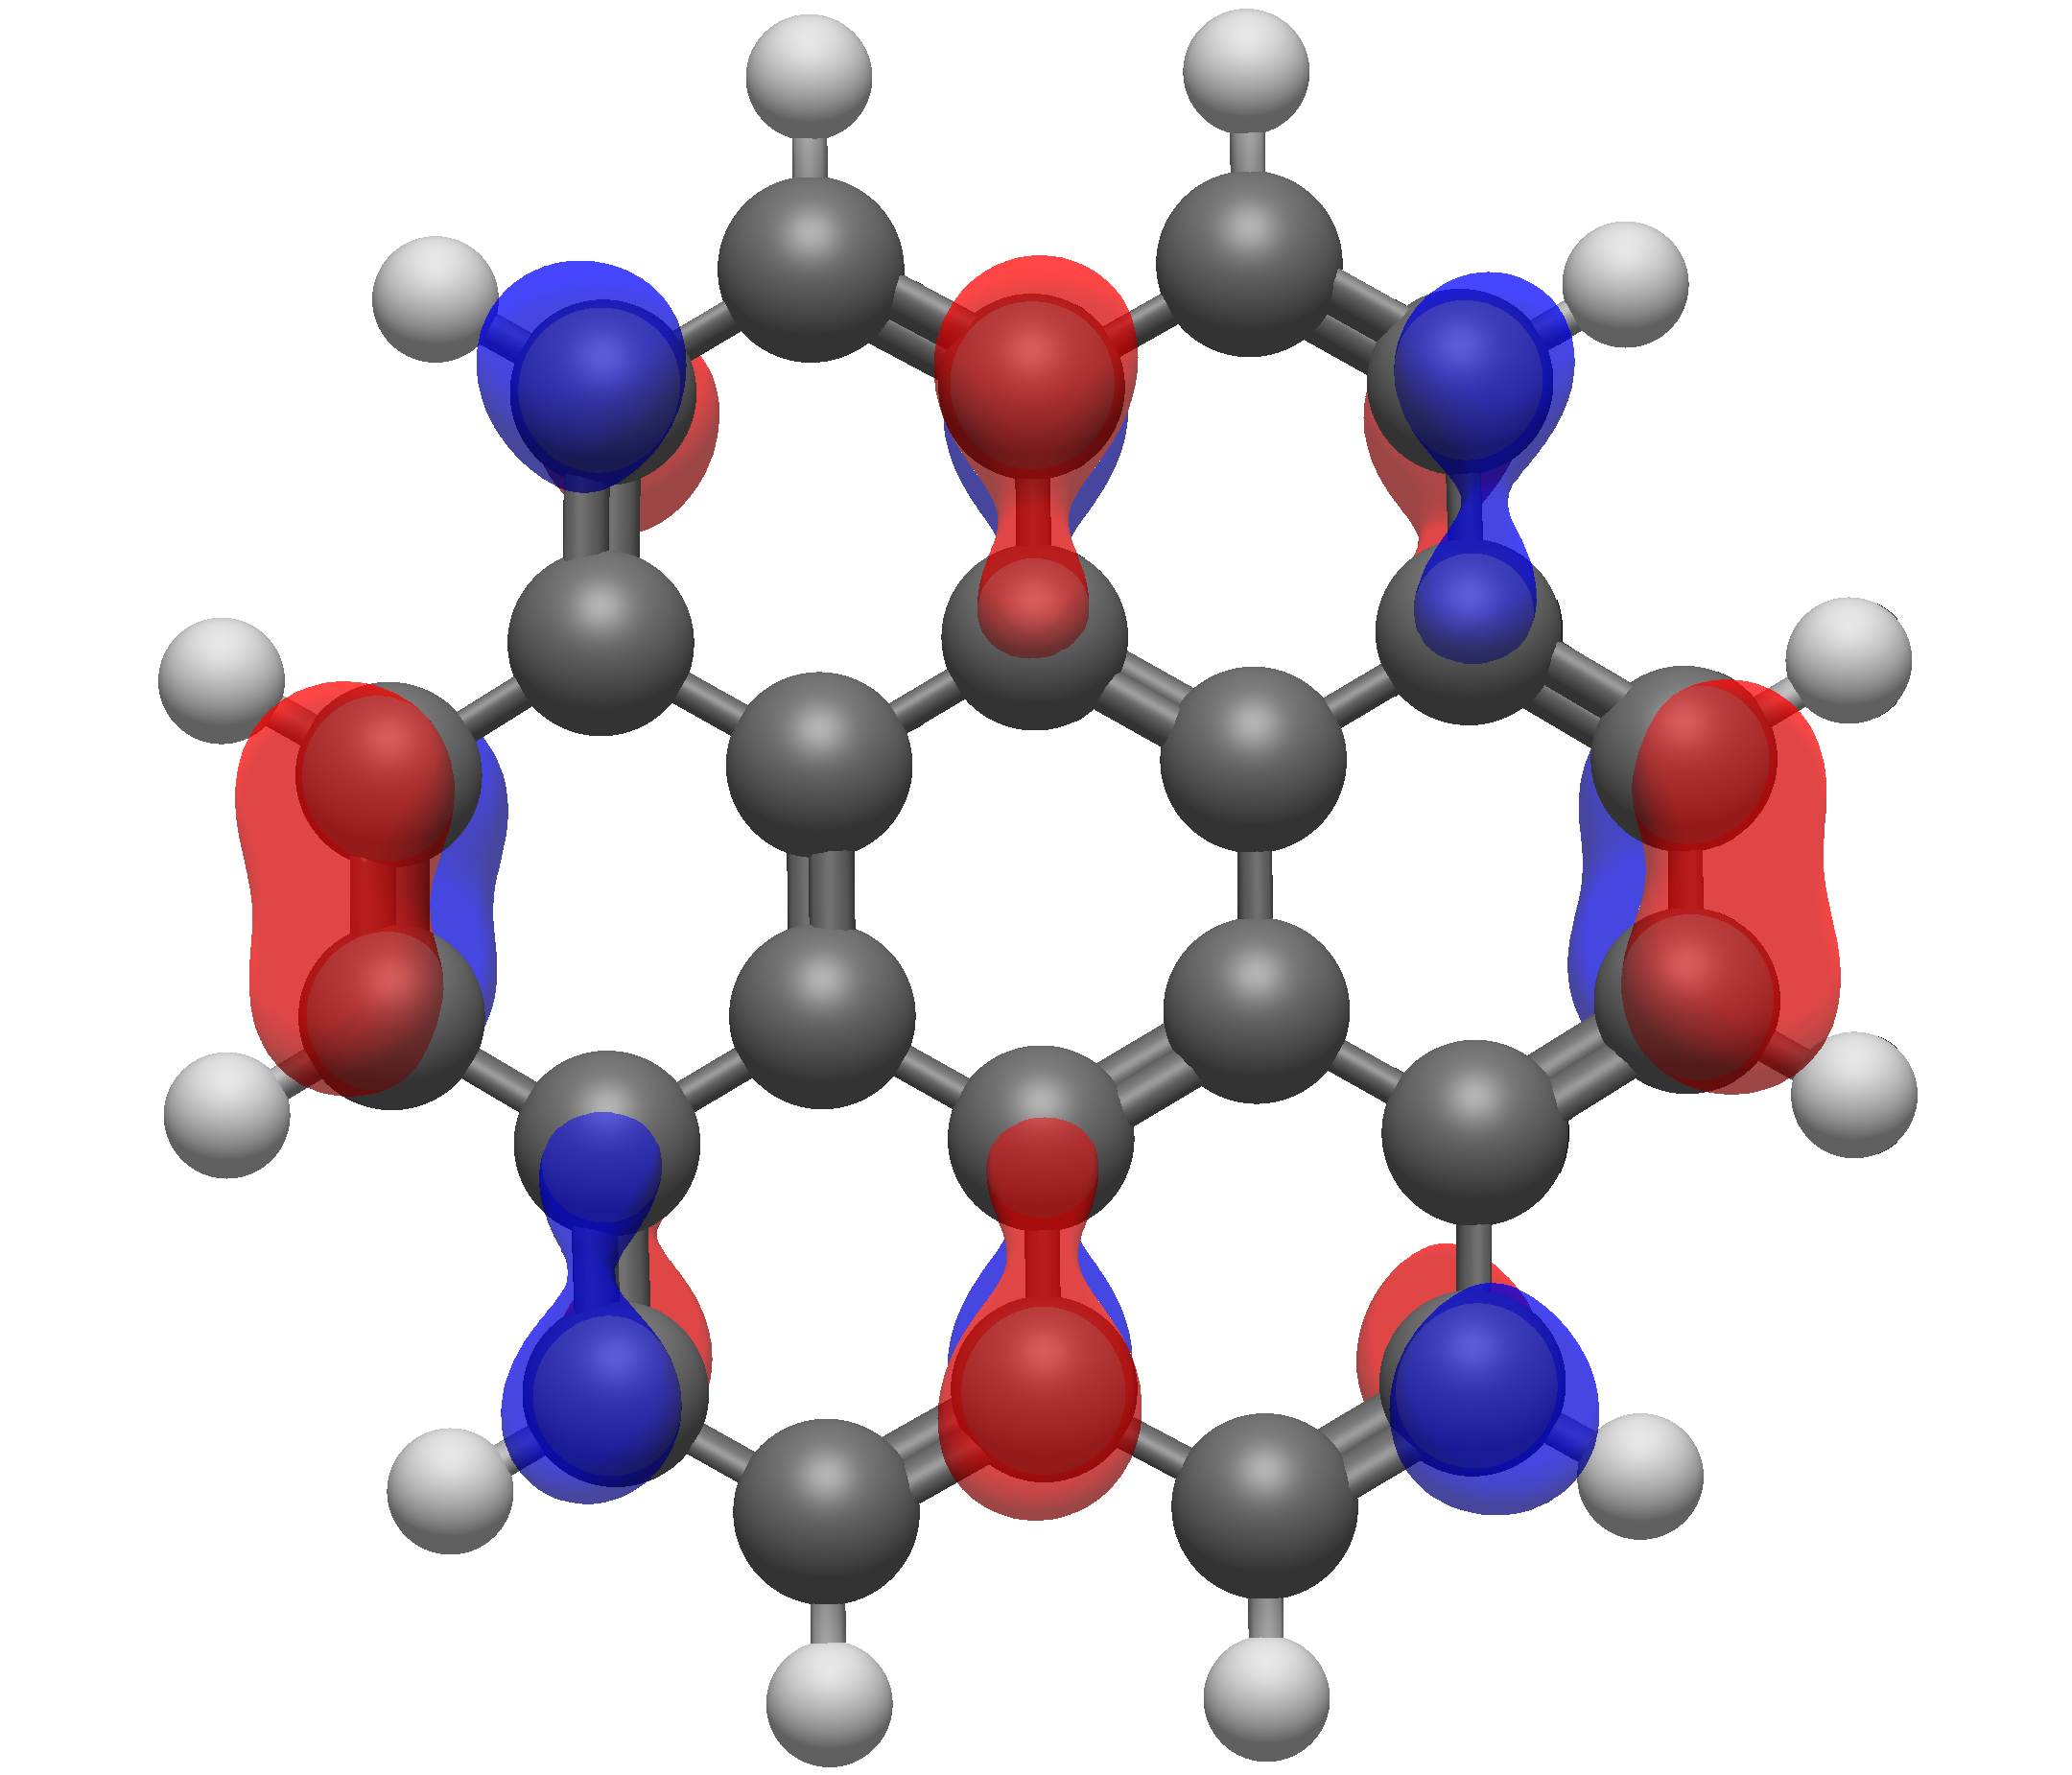
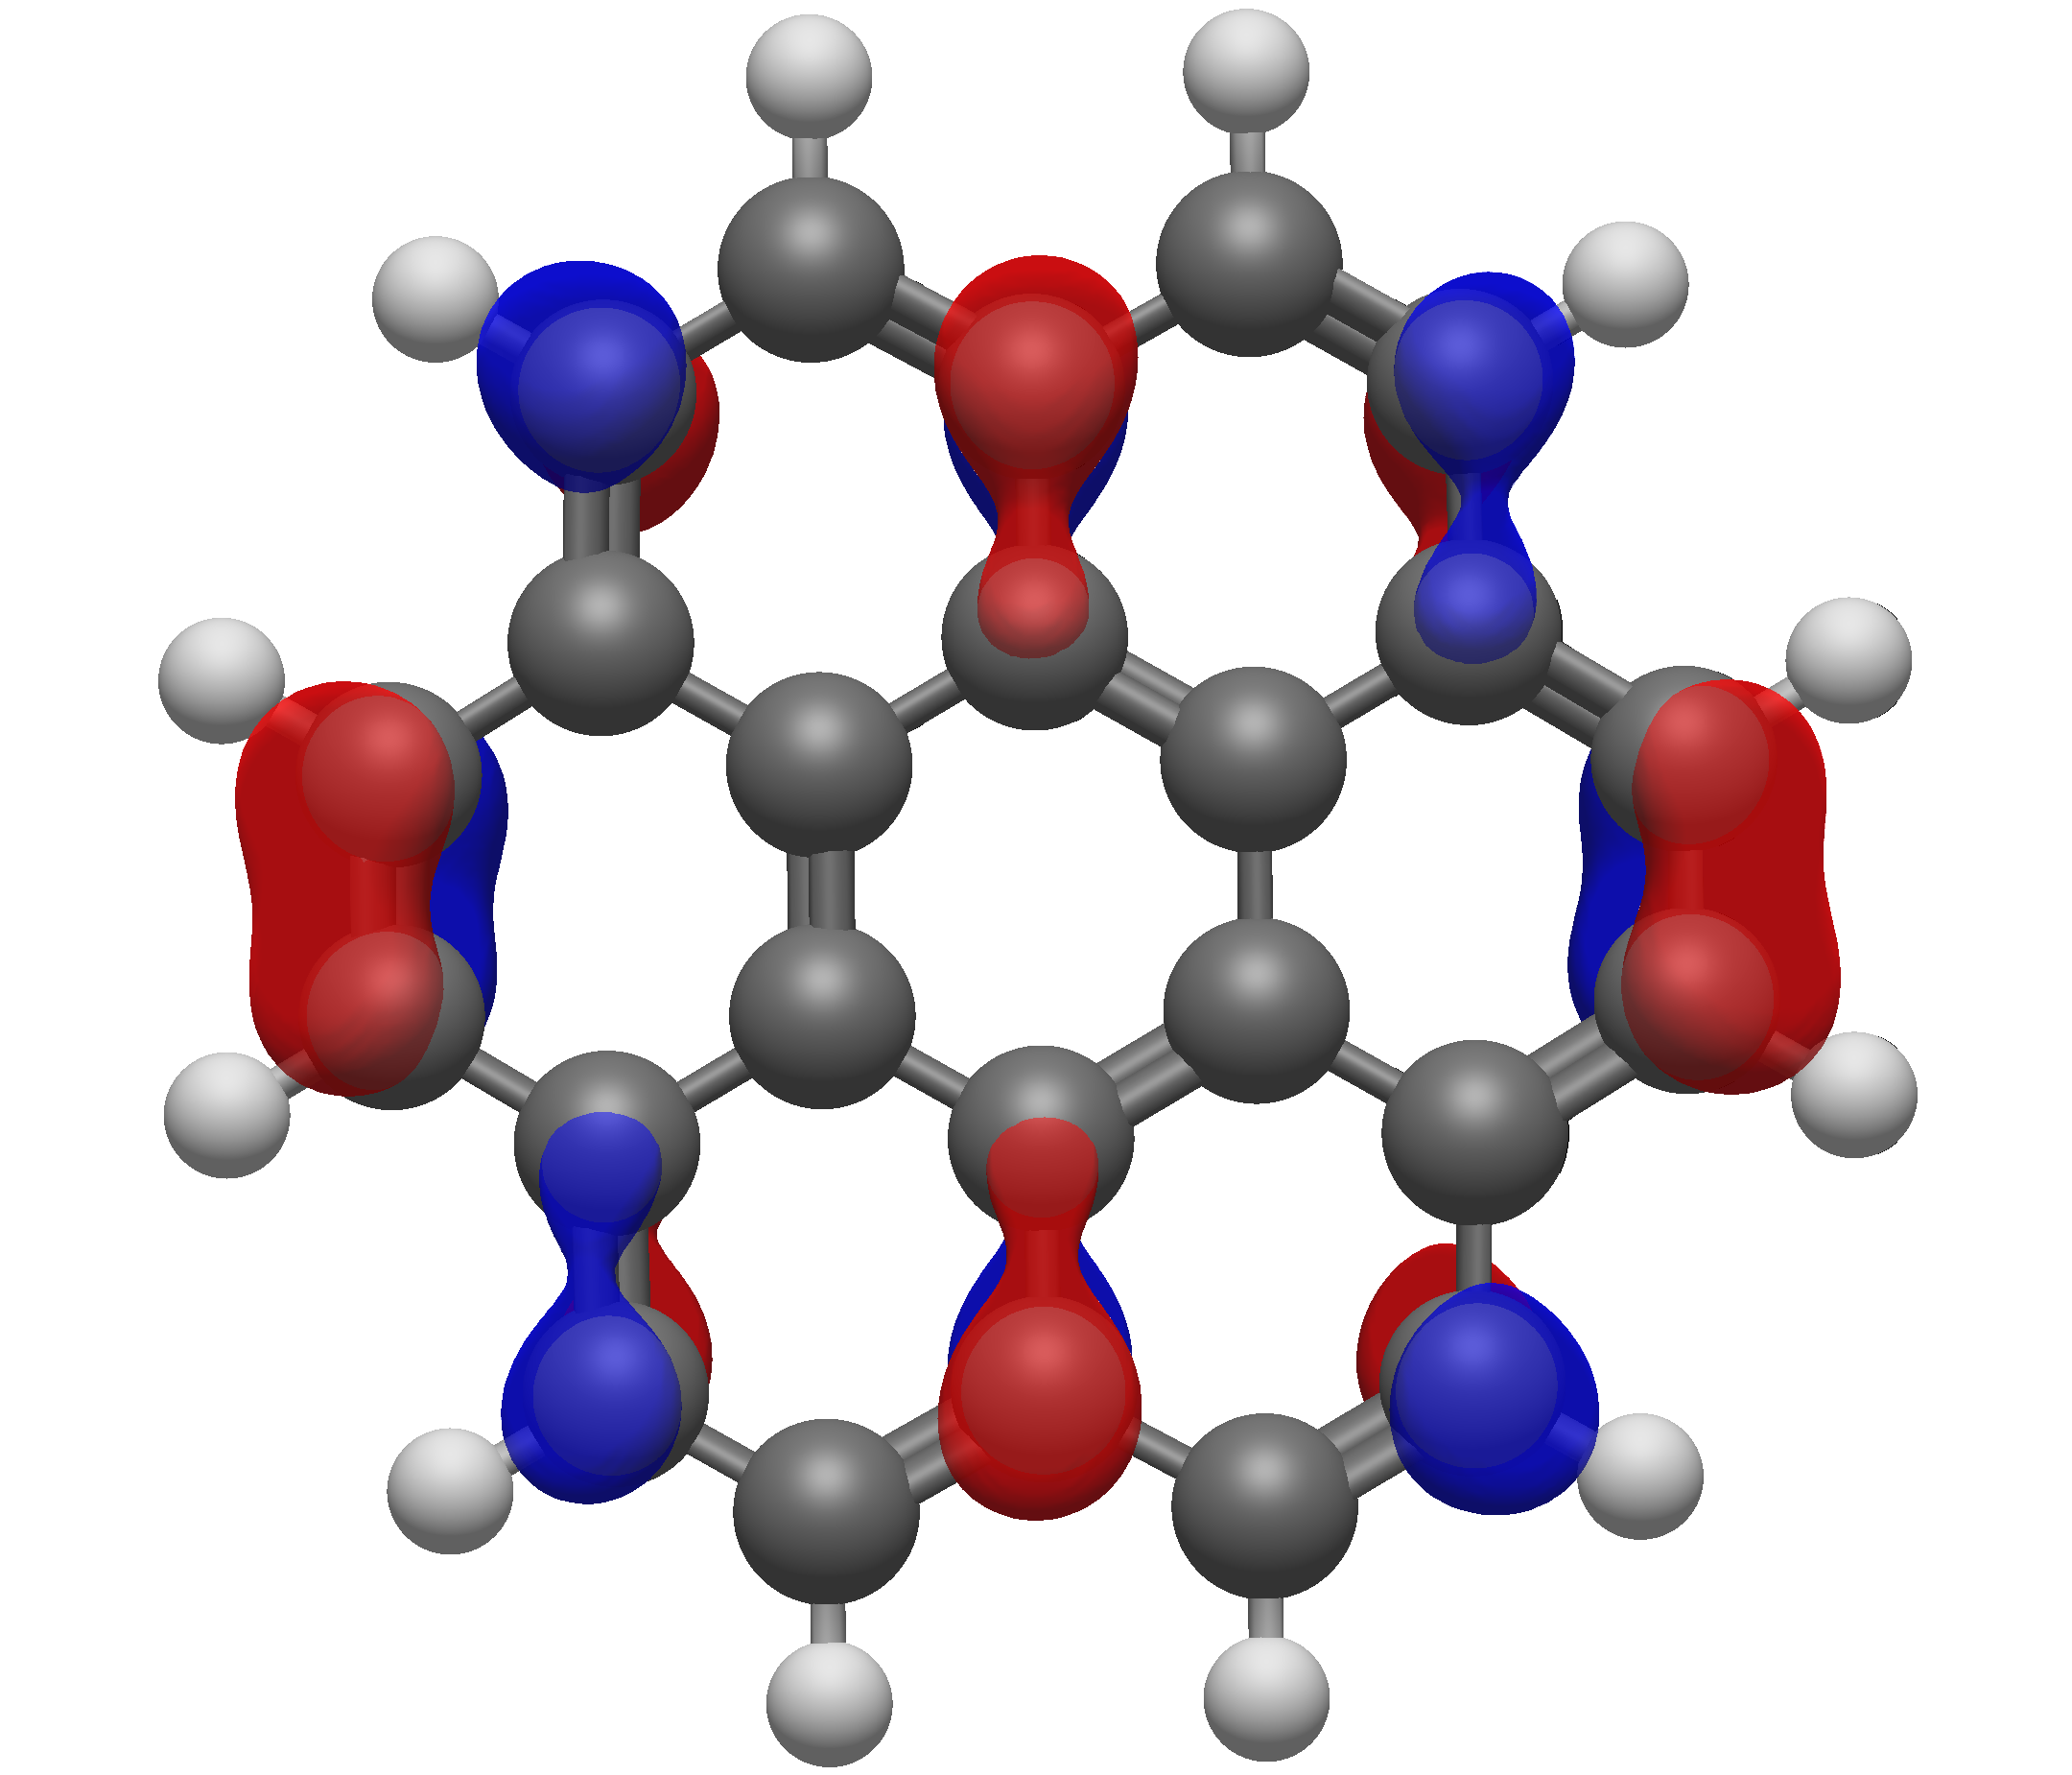
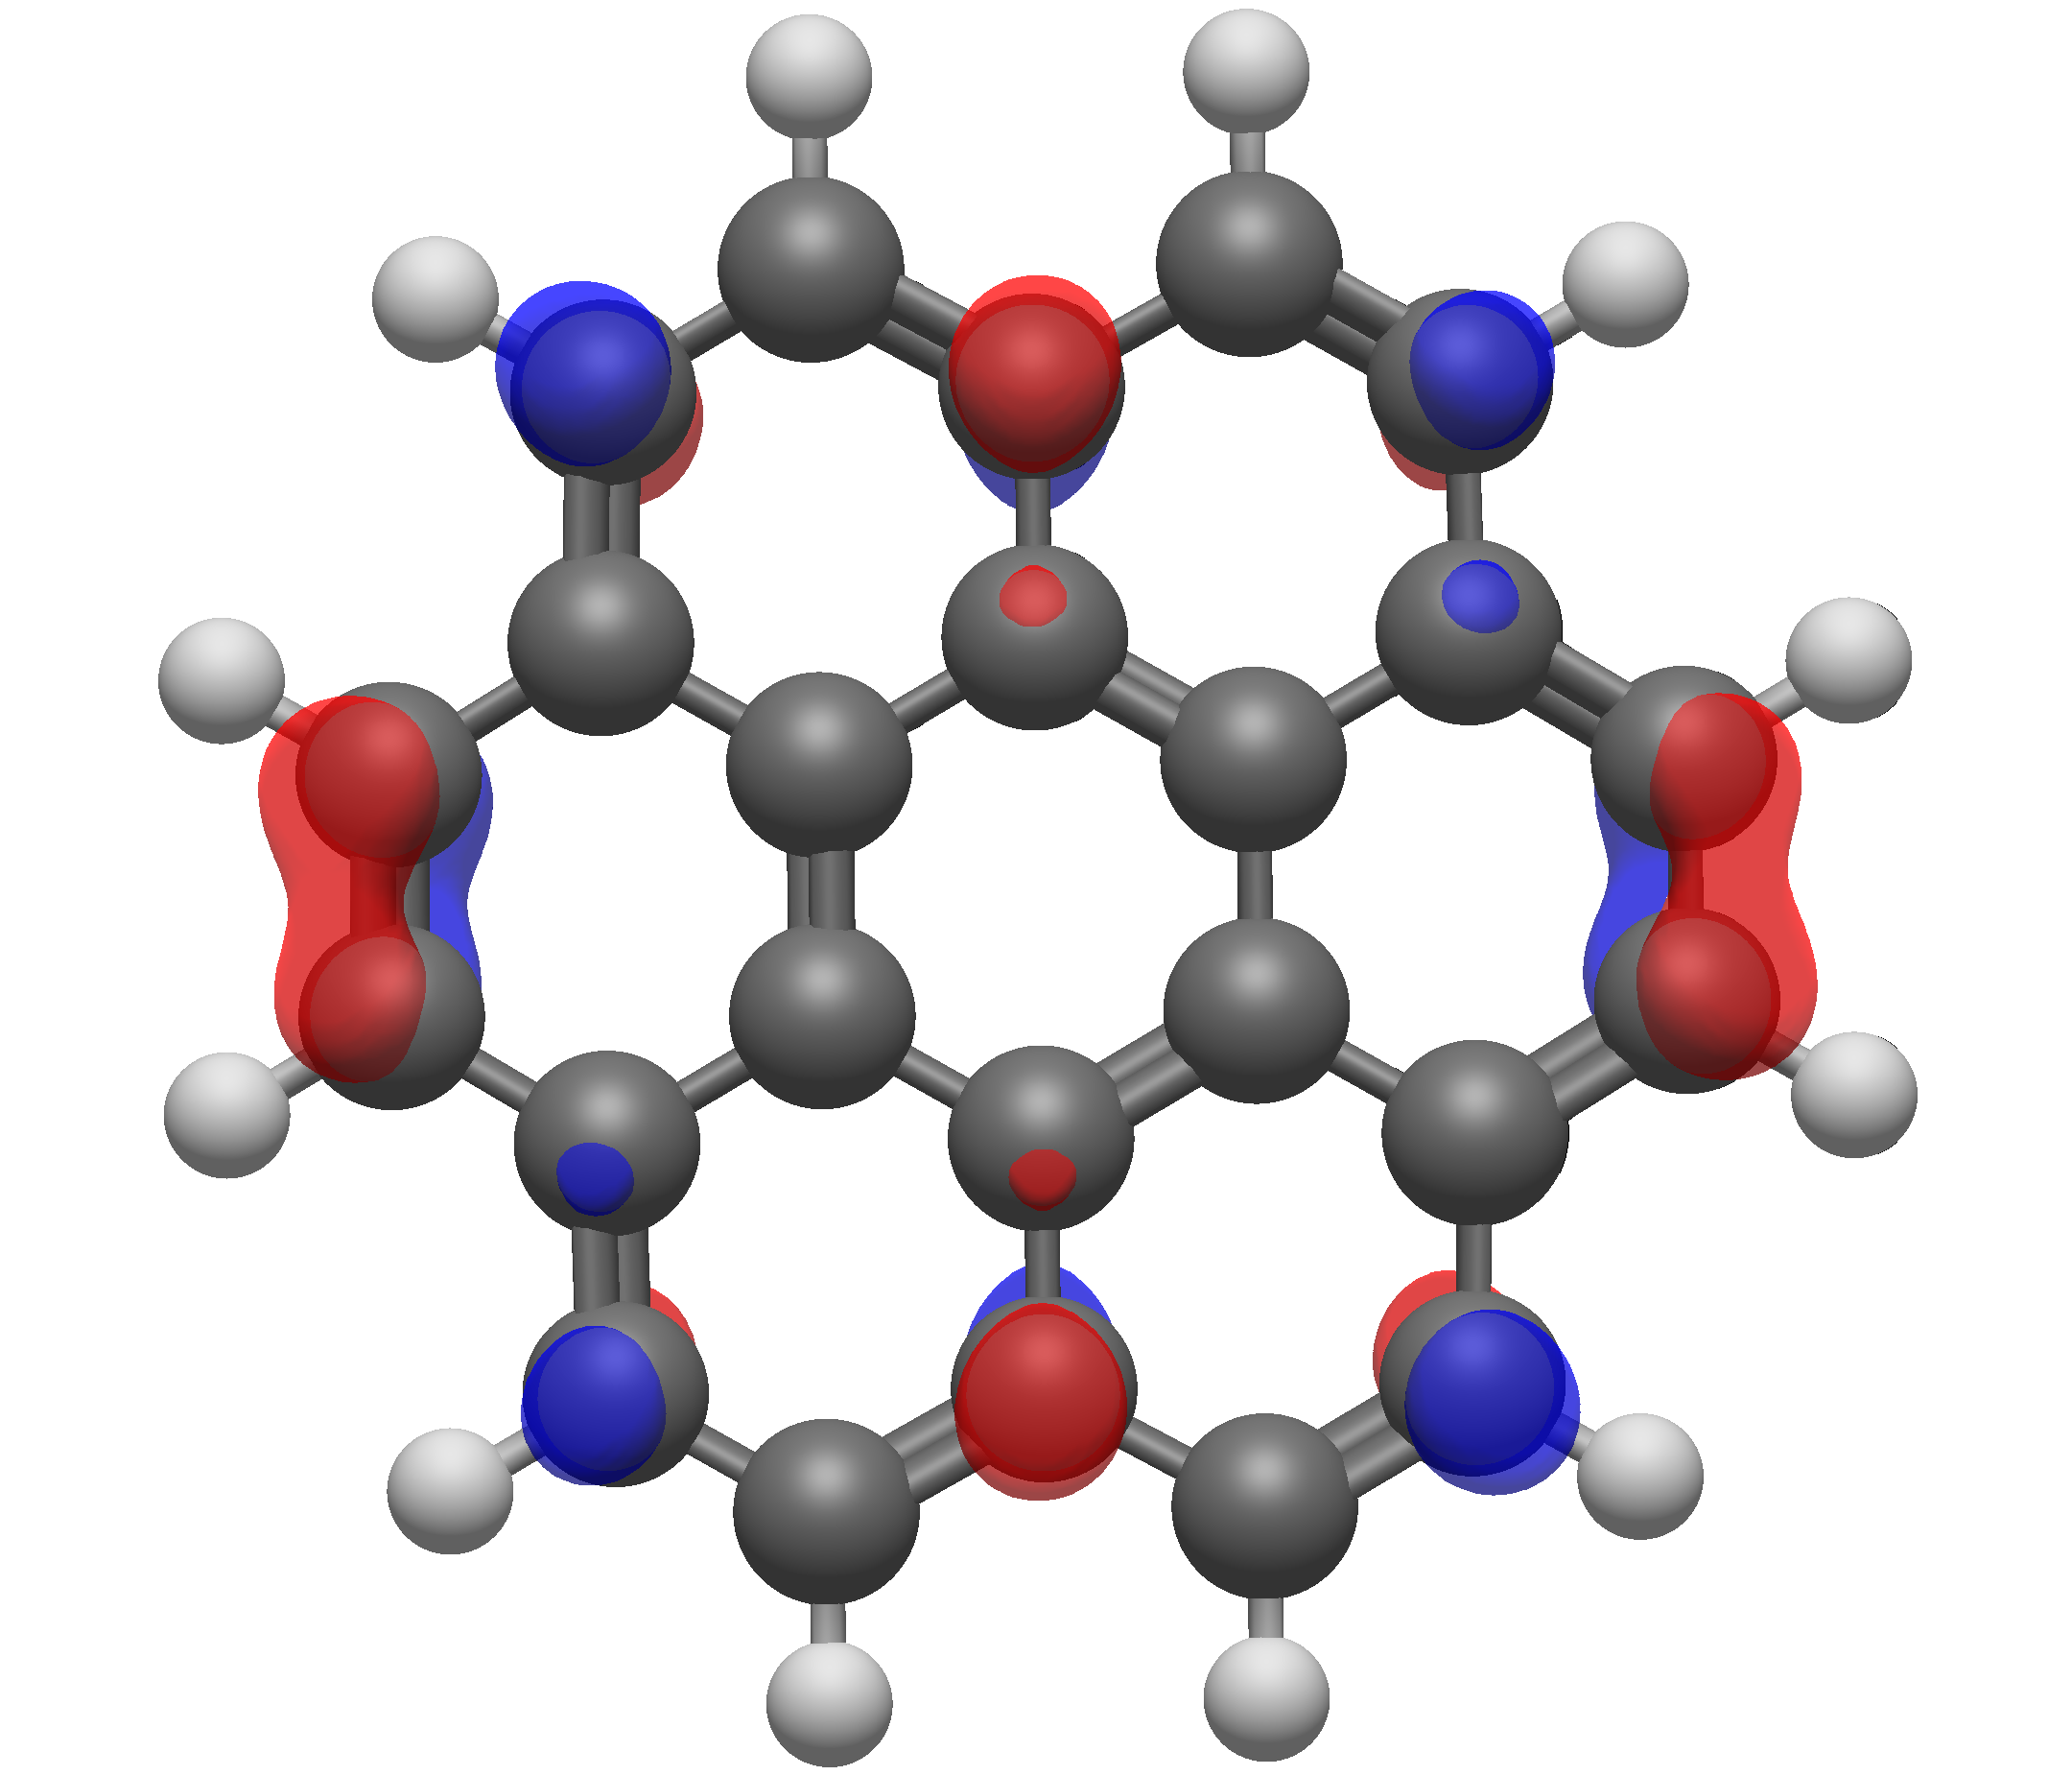
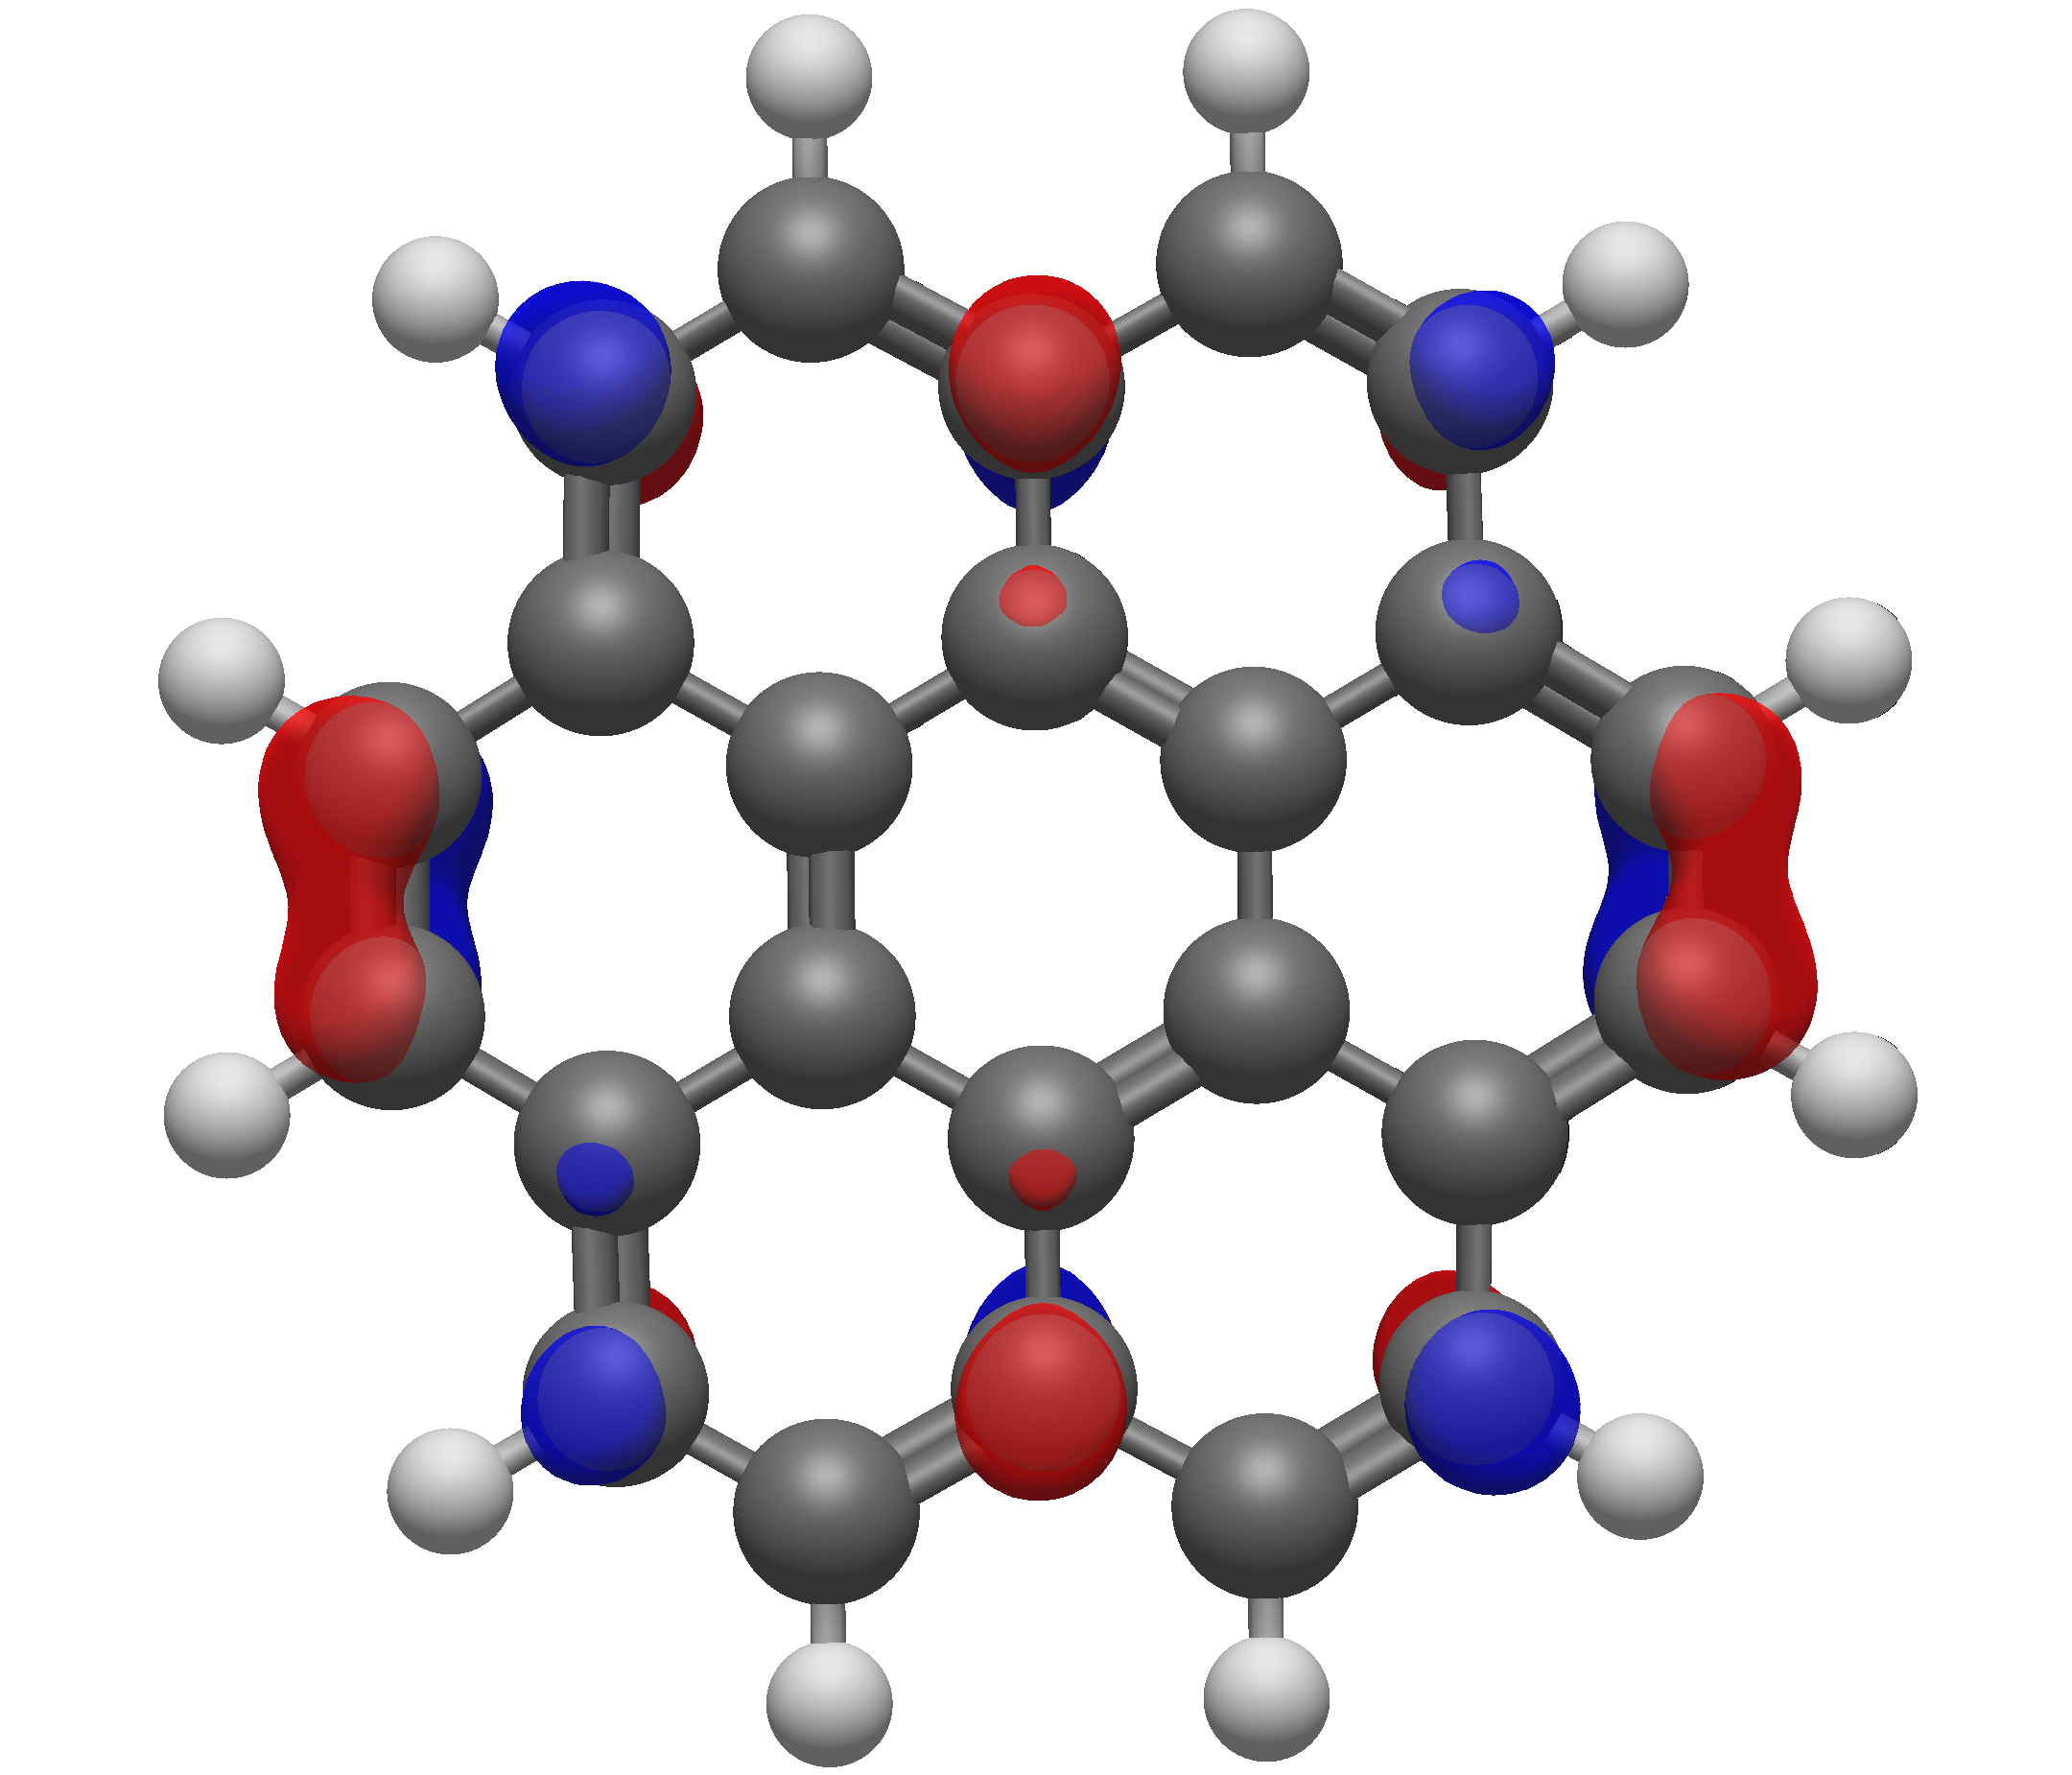
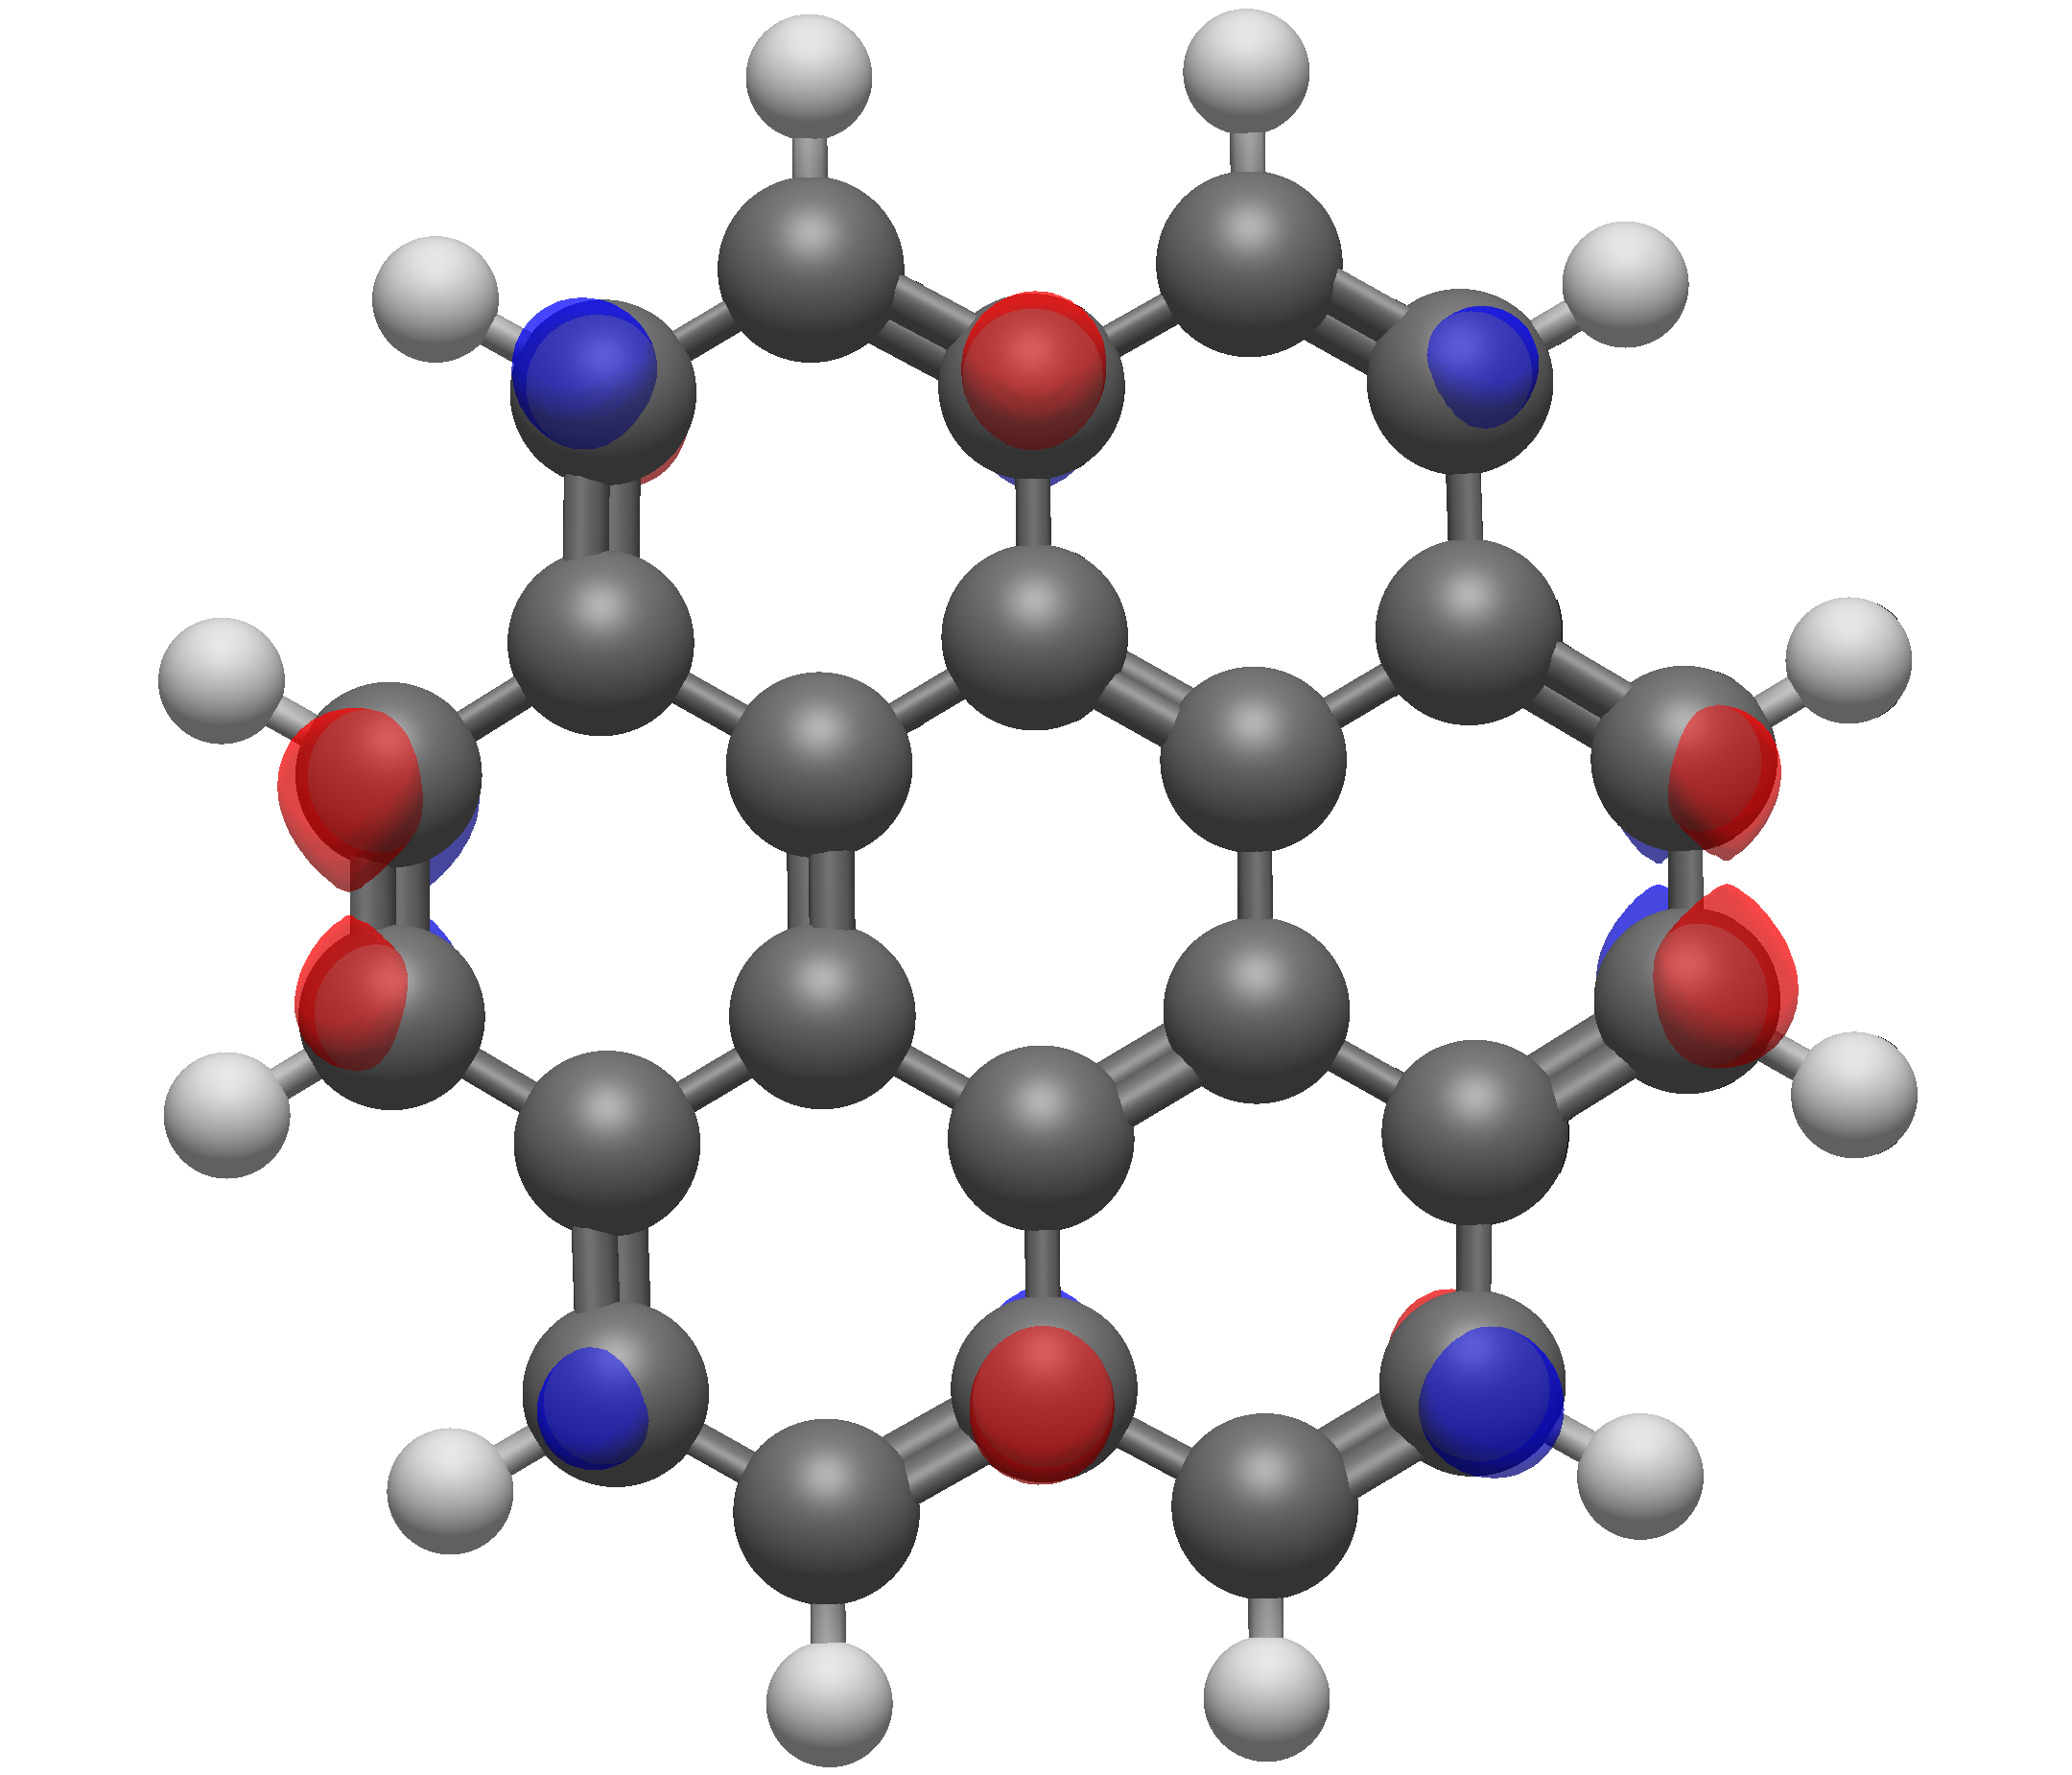
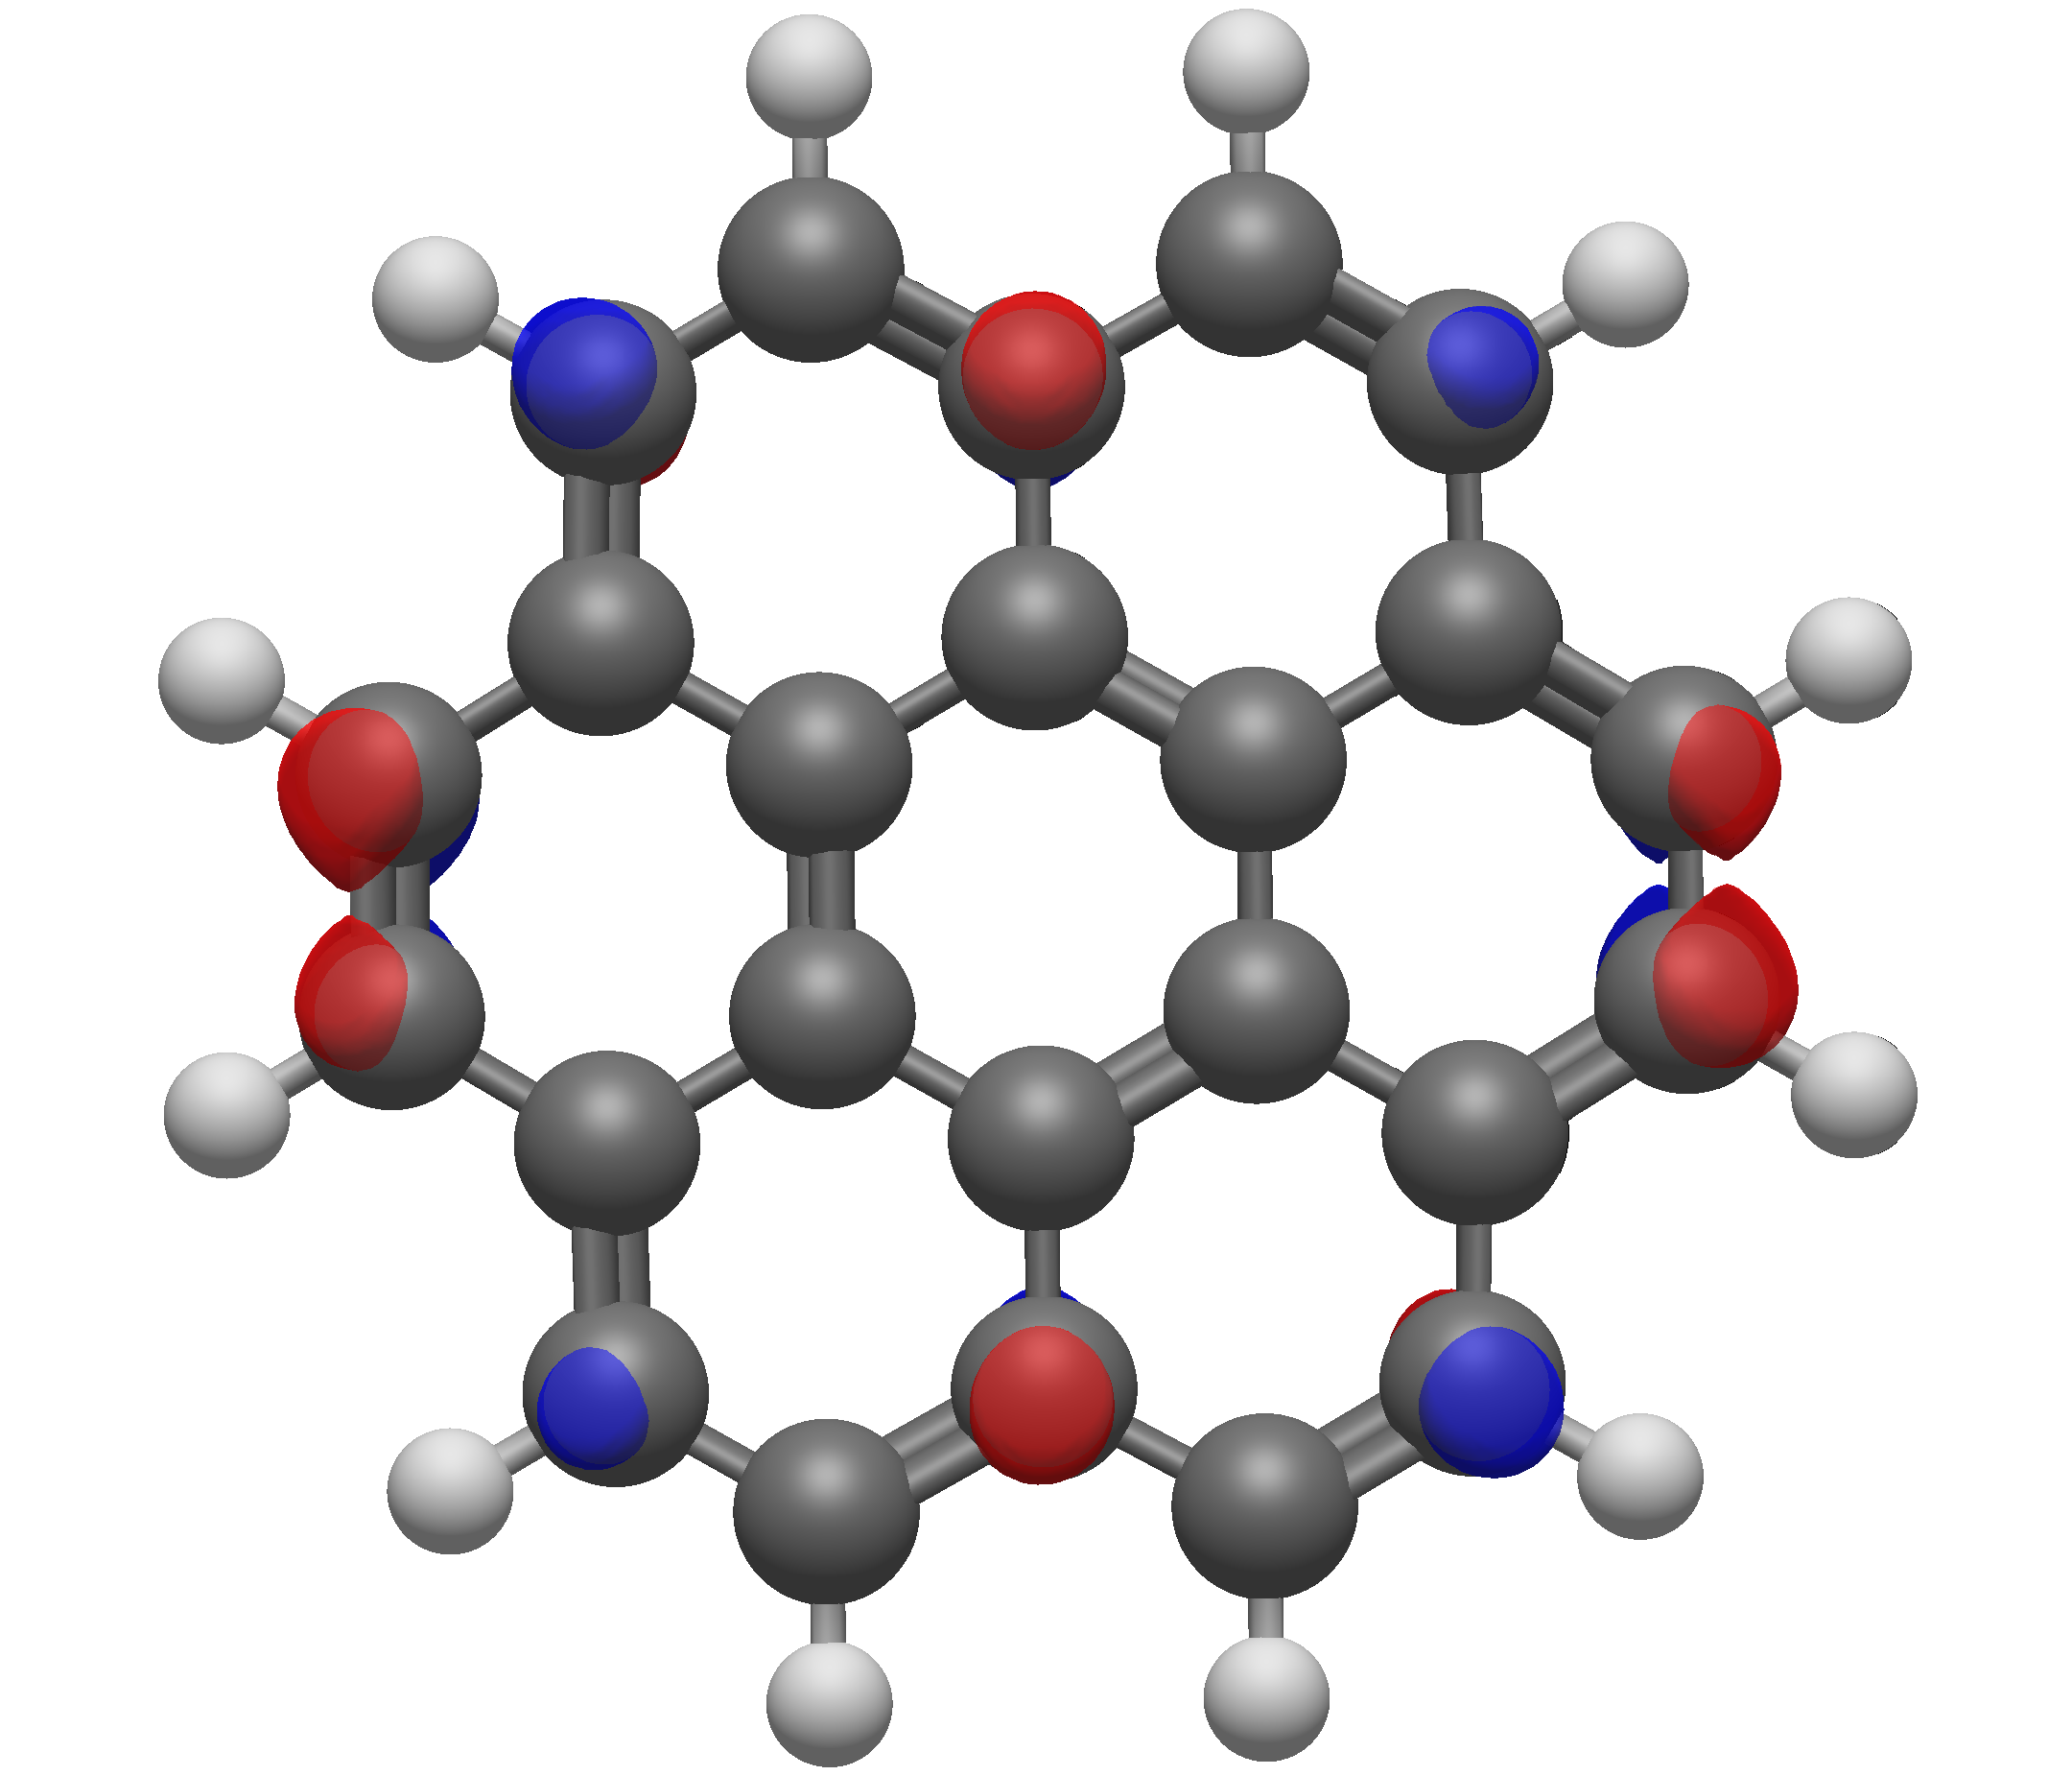
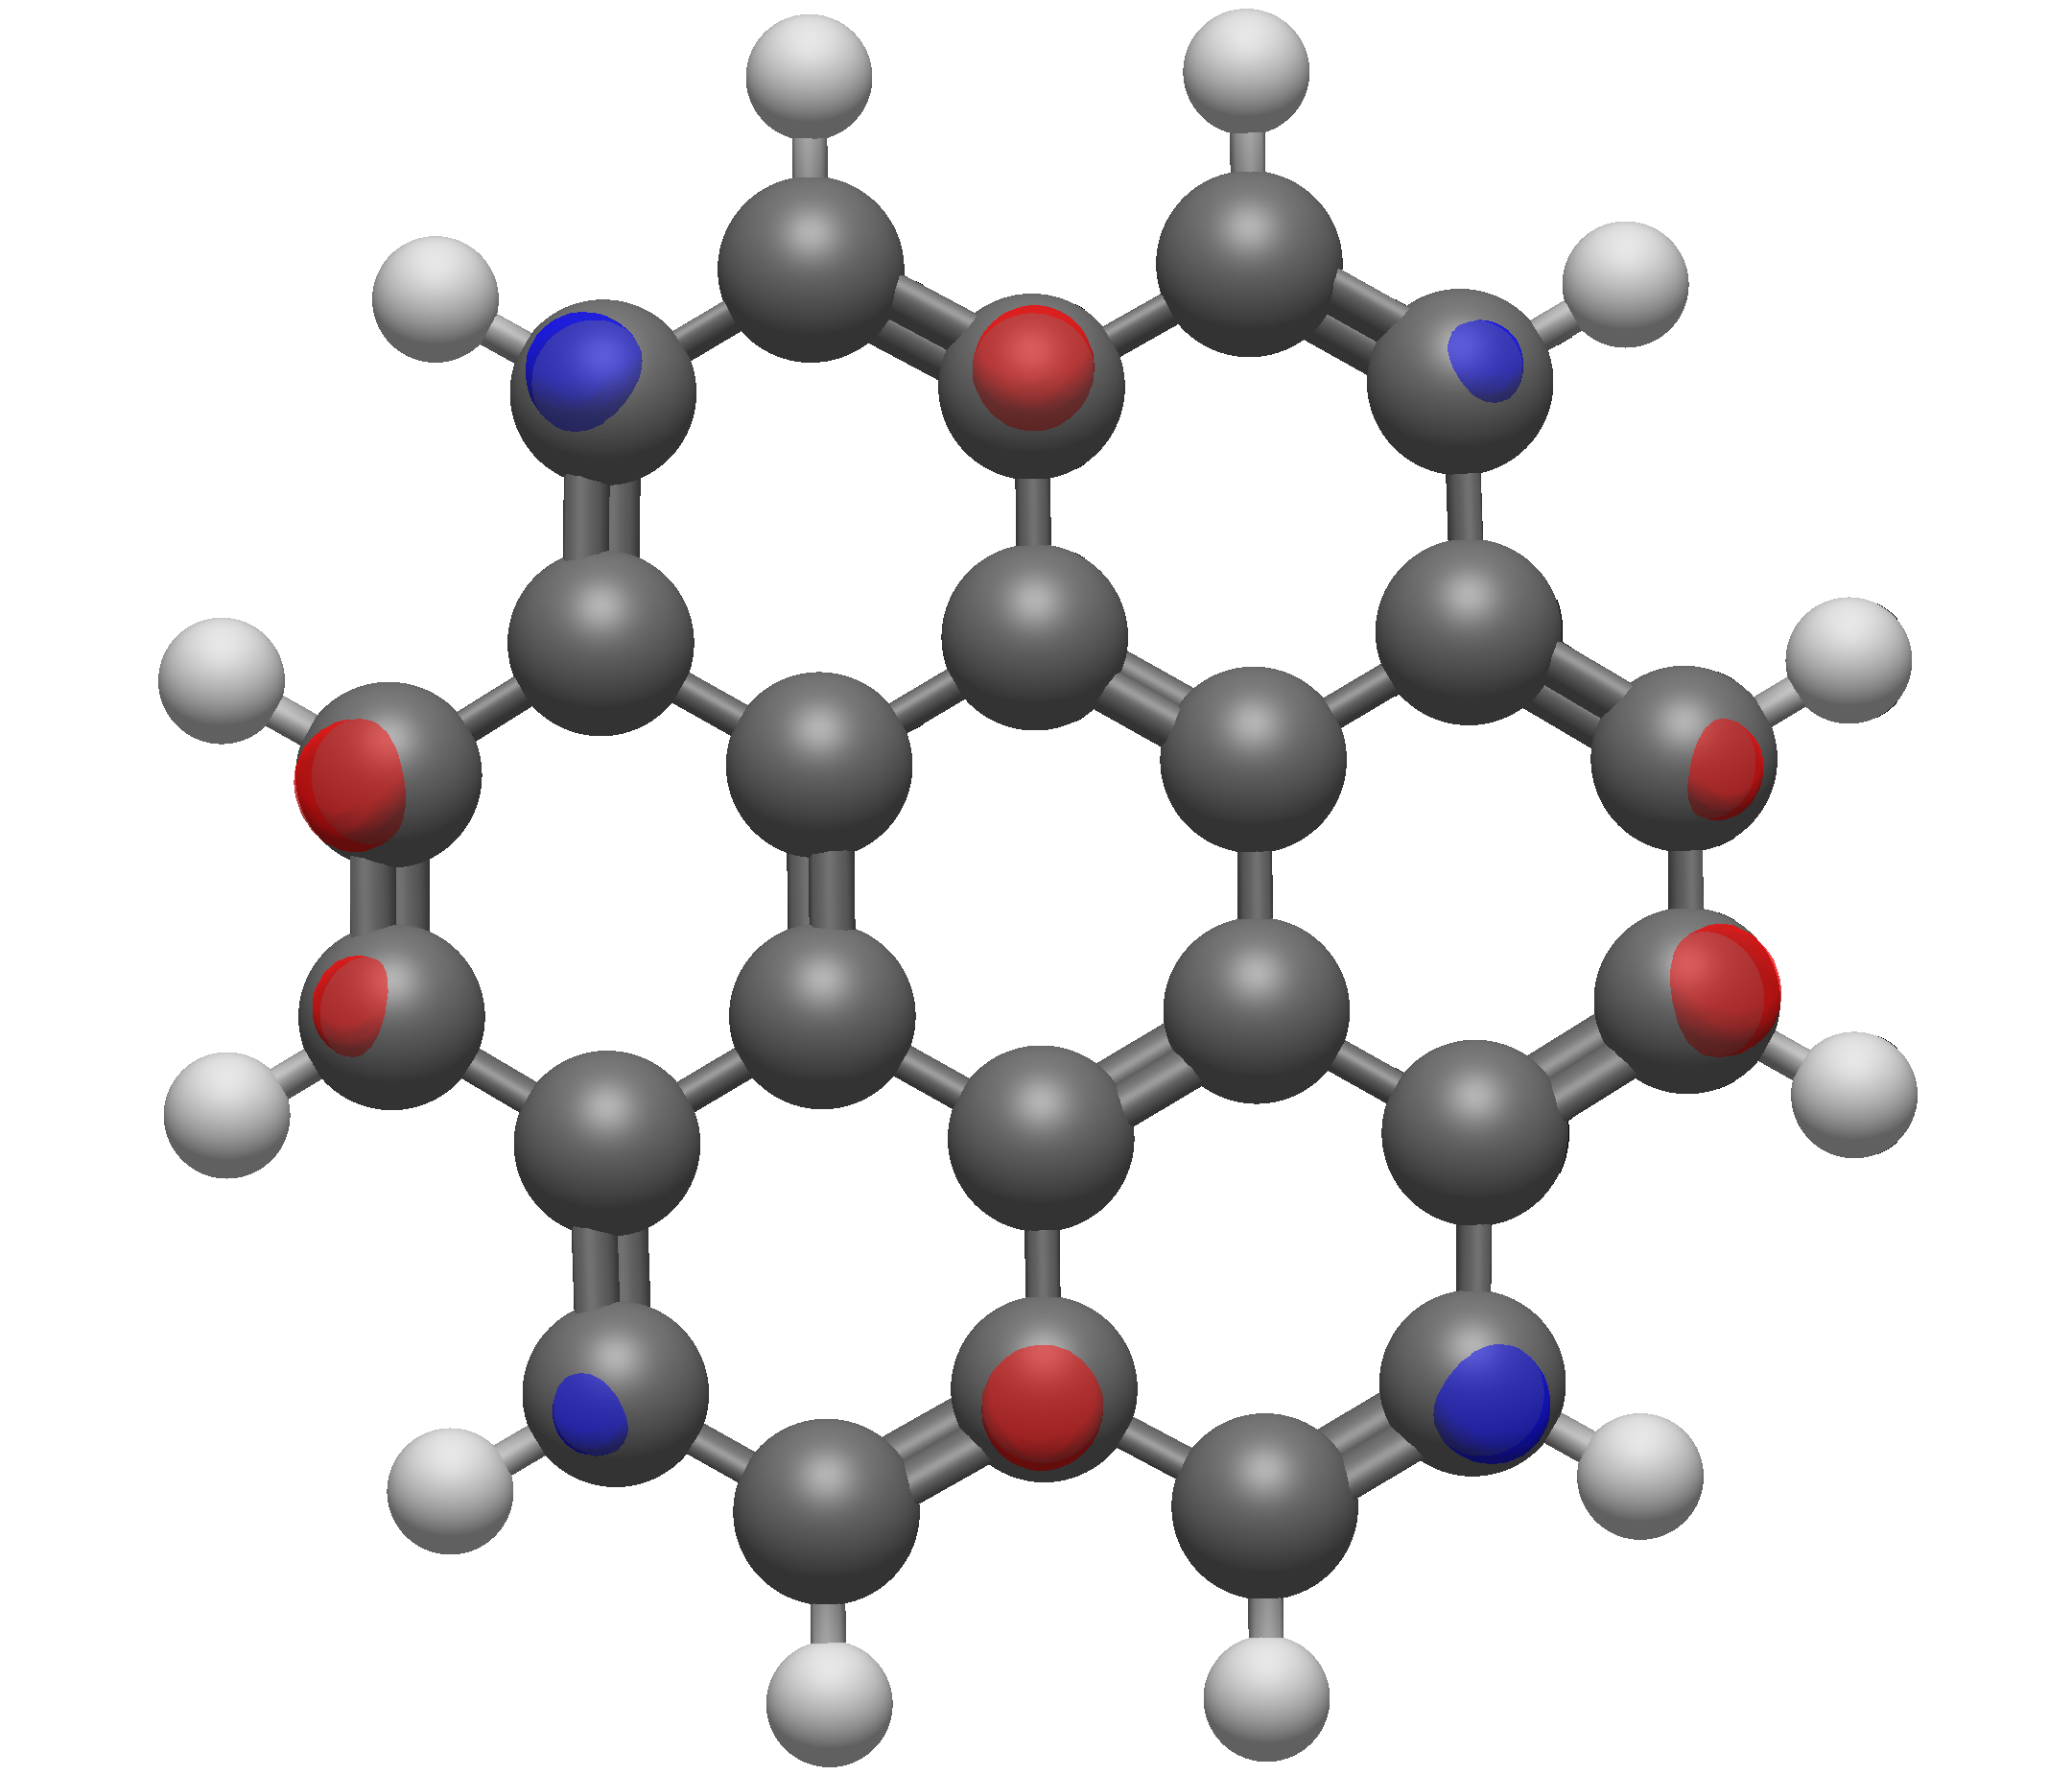


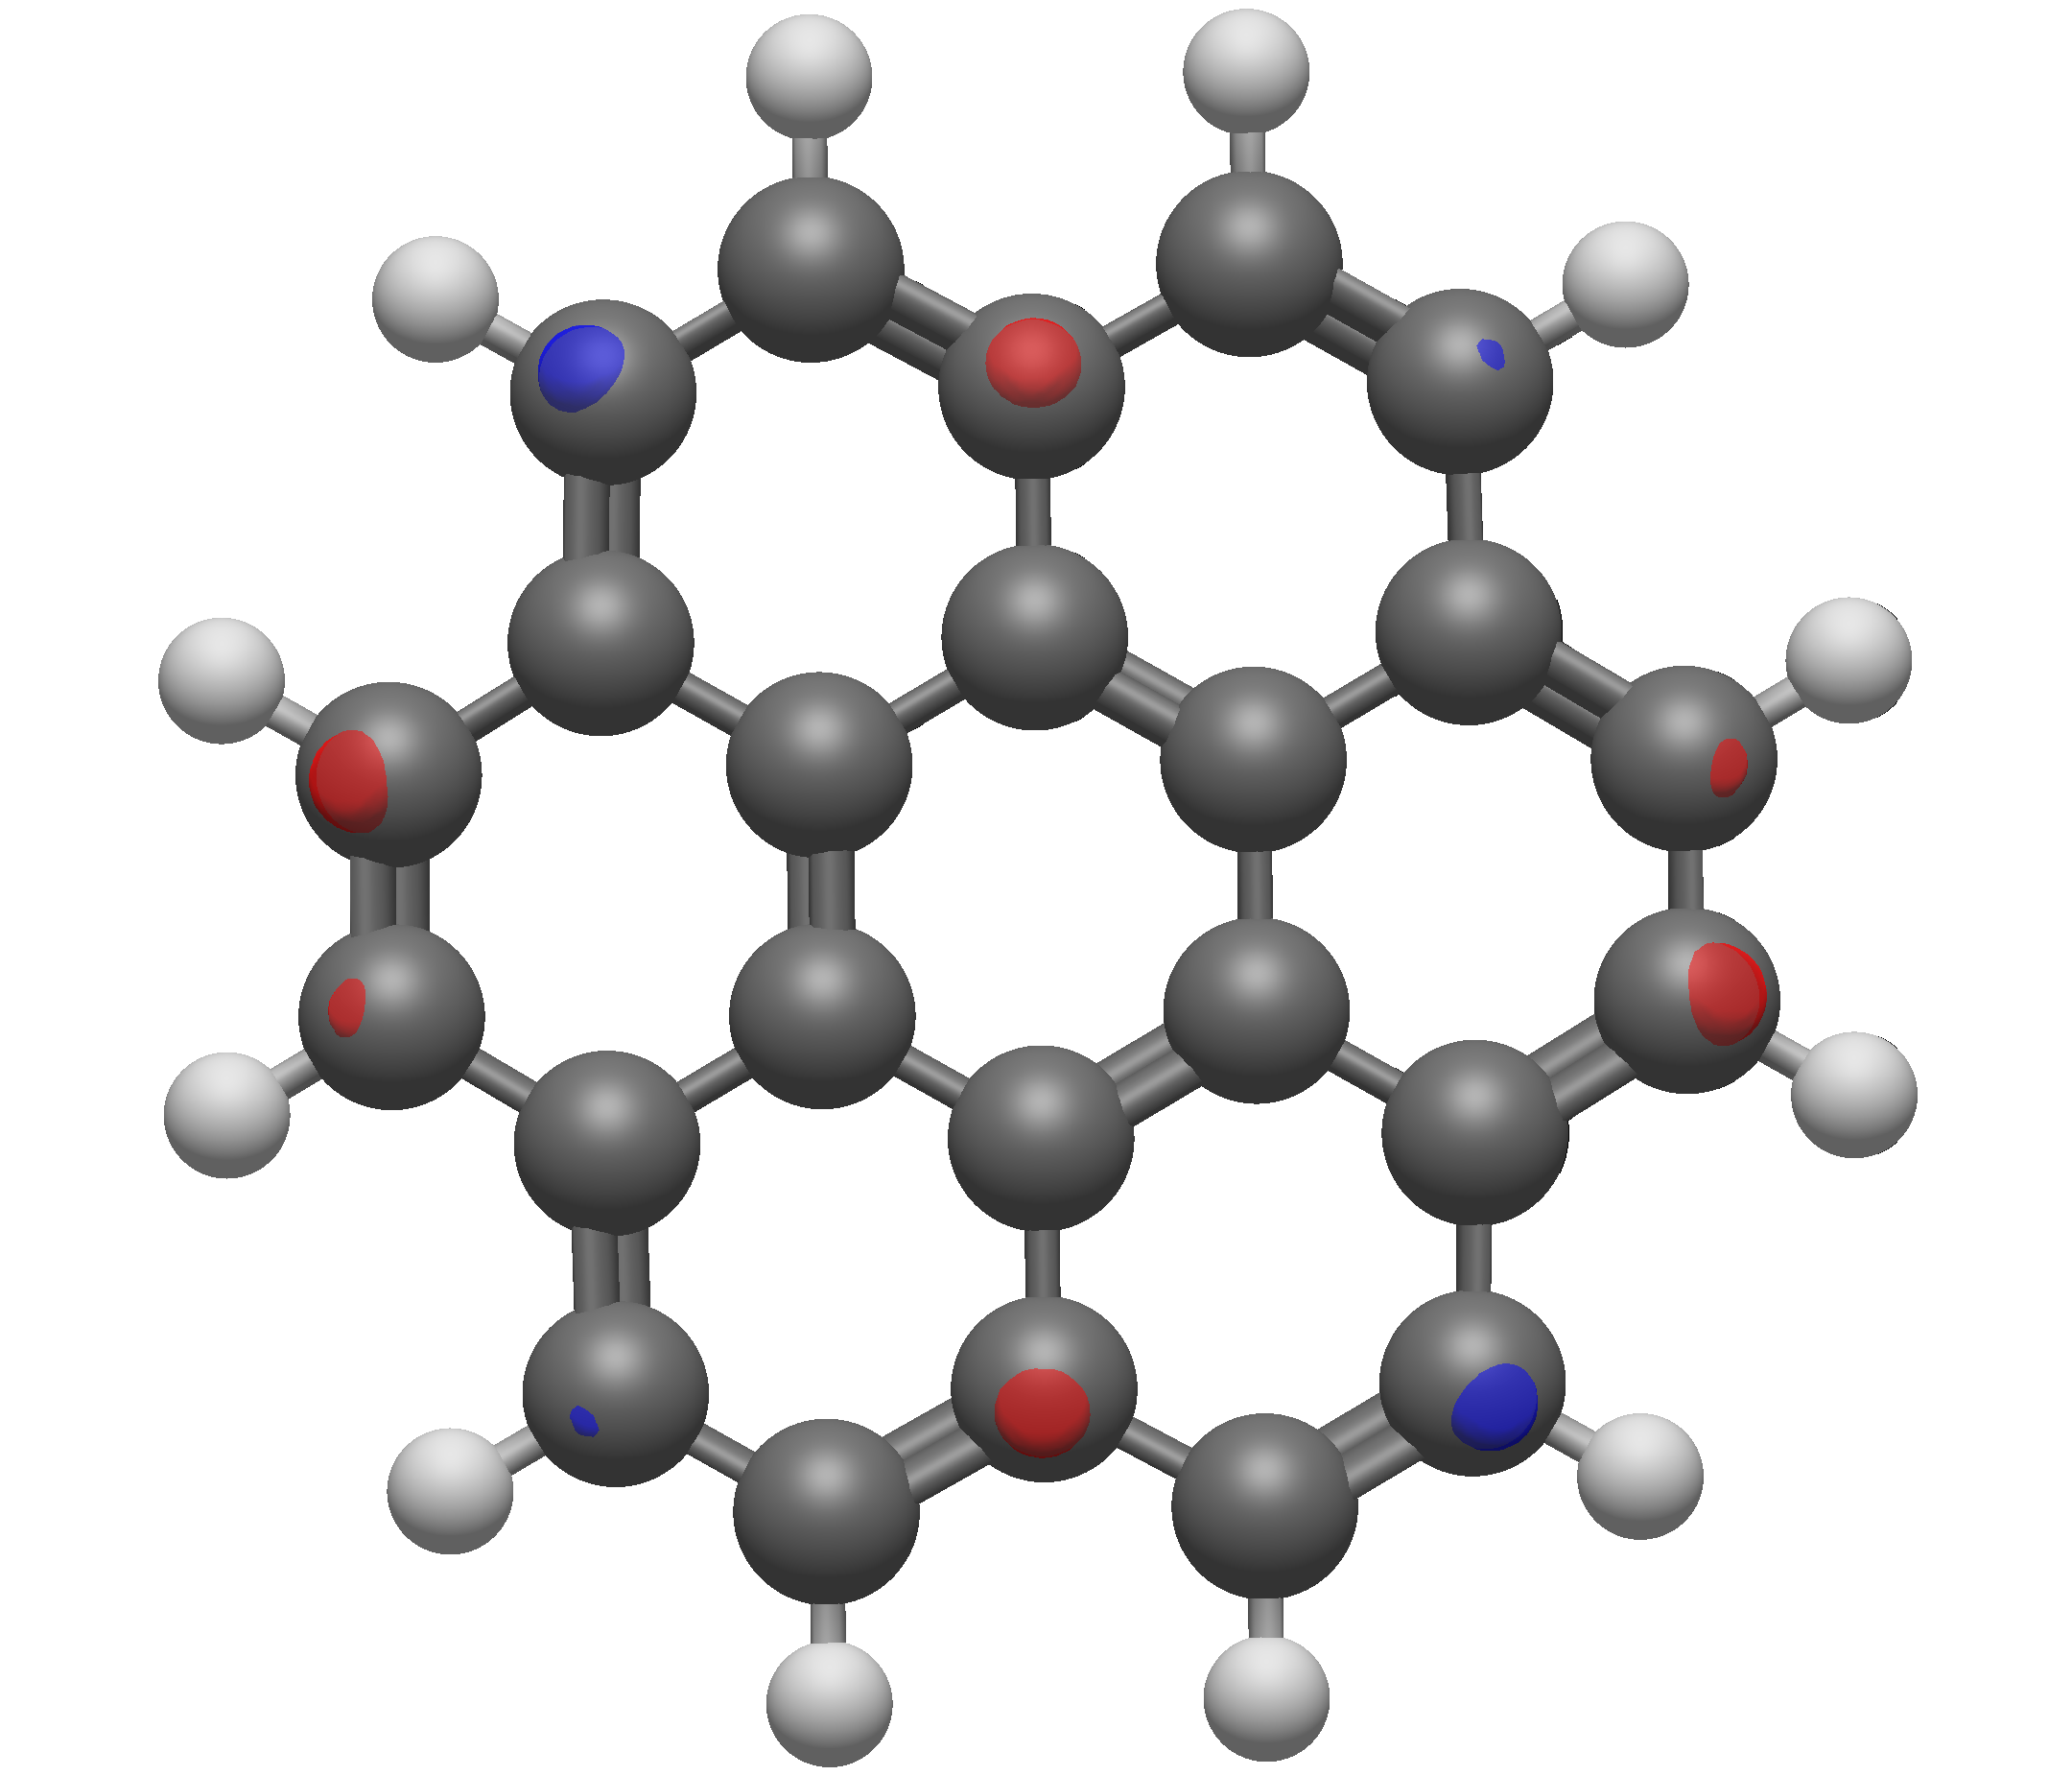

In summary, always ensure that you have chosen a suitable isosurface value for publications, and more importantly, always report isosurface values.
Smoothing#
The smoothing option, as the name implies, affects how visually smooth the surface is. In general, this has a more pronounced effect on the Van der Waals and Solvent Accessible/Excluded surfaces. Unlike the resolution, the smoothing value has a significantly smaller effect on compute time.